Differences Between Vector and Bitmap Images, and How to Optimize Images for Web Vitals in 2022
When it comes to web positioning, a key factor in getting the most visibility is to use file optimization and Web Vitals metrics to your advantage. Generally speaking, Web Vitals are scores that measure your website’s effectiveness to improve your positioning in the search engine, only if you understand what they are and how to make the most out of them.
If you are ready to take your website to a whole other level, keep reading! In this article, you will learn how to use image optimization and Web Vitals as an opportunity to boost your SEO. We know this can be a complex and sometimes even confusing topic, so let’s start with the basics.
What are Web Vitals?
Web Vitals are a Google initiative that offers several different tools developed to measure performance and provide a detailed report evaluating user experience on a website.
Since the beginning of this initiative, Google has developed so many metrics that can be obtained from your website, such as being mobile-friendly, loading speed, use of https, interstitial displays that prevent seeing the content of the page, amongst many others.
If you’re in the web development world, then you’ve probably already heard about these before! However, not everyone is an expert in using these tools and some find it challenging to keep up with the enormous amount of metrics available, this is why we keep on hand this easy-to-use tool to get useful insights on your websites.
As for Google, after realizing that site owners shouldn’t be web performance gurus to be aware of the quality of the experience they provide to their users, Core Web Vitals were born: three simple and unified criteria on what a good web experience should be.
Site owners shouldn’t be web performance gurus to be aware of the quality of the experience they provide to their users.
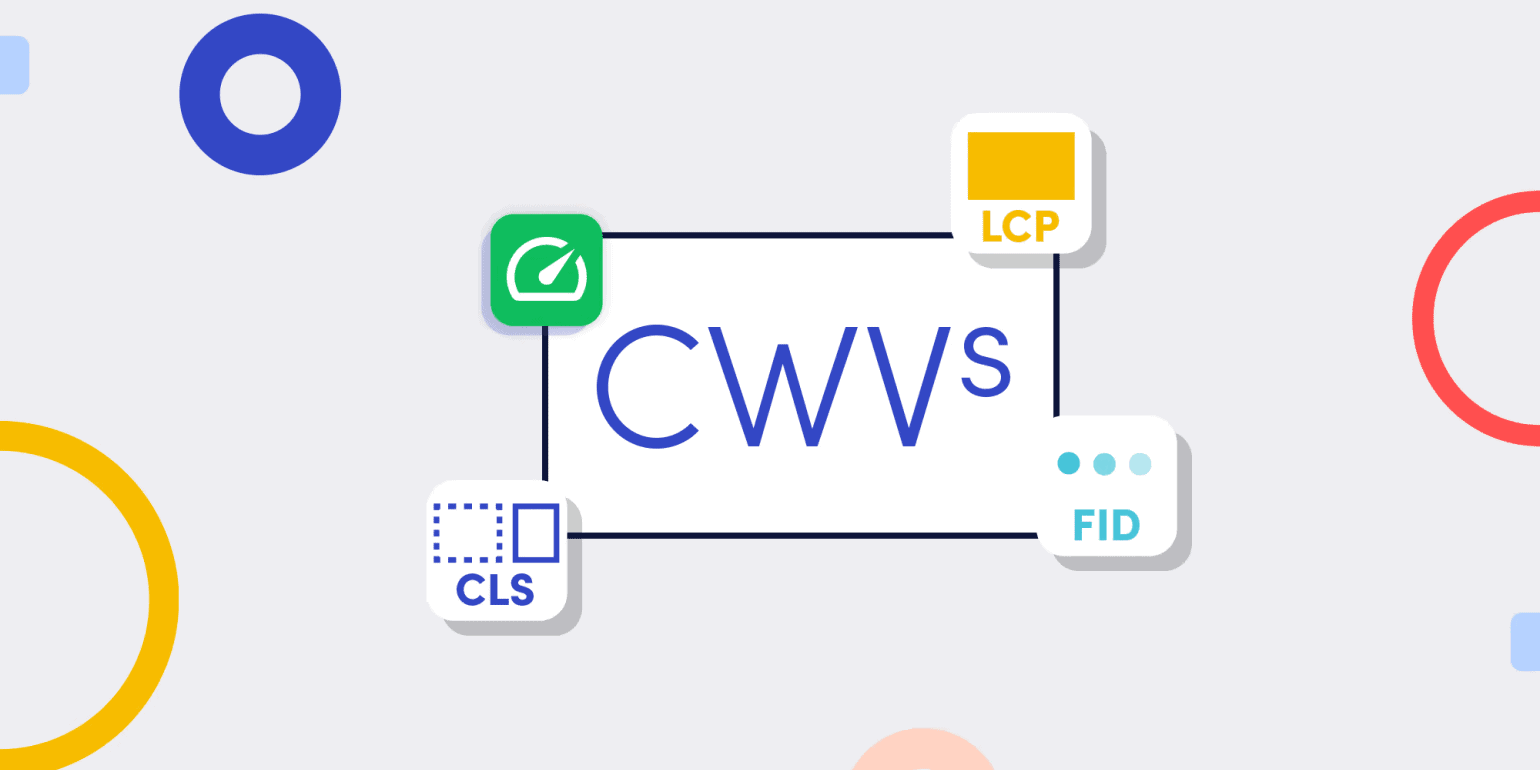
Core Web Vitals
These are the statistics that every website owner should measure on a regular basis, as these apply to all websites and each represents a different key factor that reflects the user experience in the real world. Although they were introduced in 2020, as of June 2021 these metrics started to be taken into account, along with the existing ones, as influential factors for search engine positioning under the name of “page experience”.
Currently, they focus on three aspects: loading speed, visual stability, and interactivity which are measured with the following metrics.
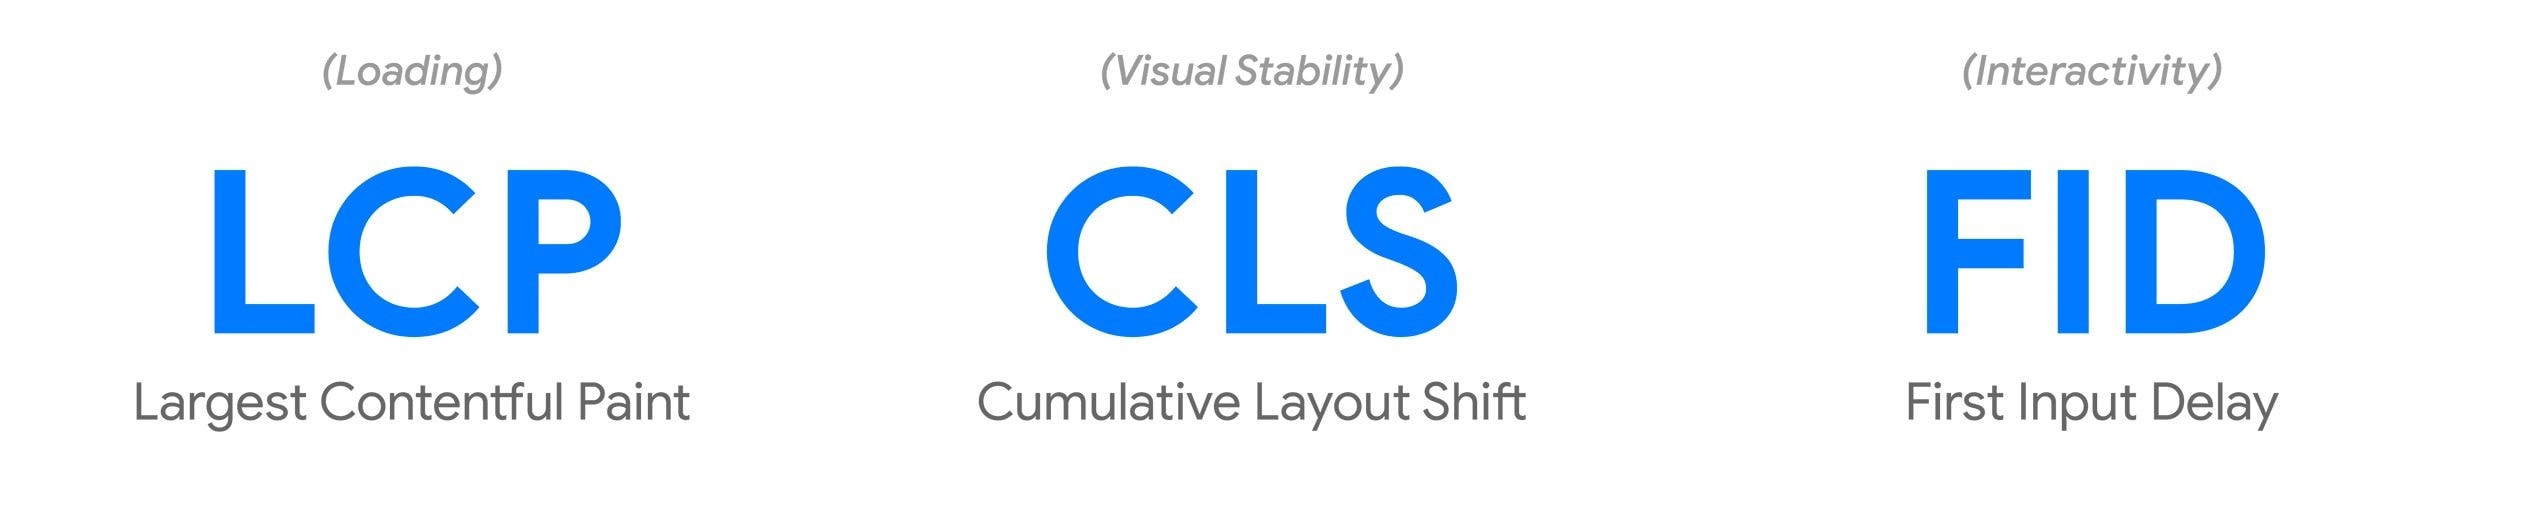
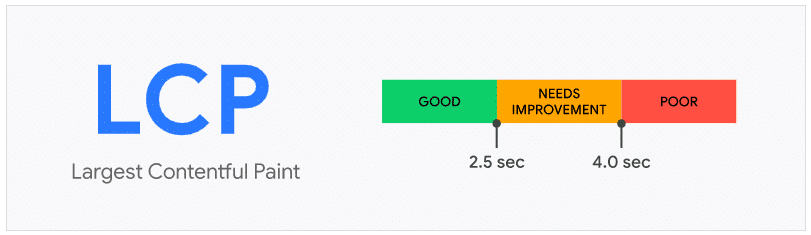
Largest Contentful Paint (LCP)
This refers to the perception of loading speed. Let’s say you click on a website, and before scrolling down you wait for the first thing you see on the page to fully load. That is exactly what this measures: the waiting time in which the largest content above the fold loads and gets to be viewed by the user. This element can either be an image, video or text.
Ideally, it should be less than 2.5 seconds, this means that the largest content should be viewed in this time or less from the start of page load. Anything higher than that is considered a poor user experience and must be improved to get a better ranking.
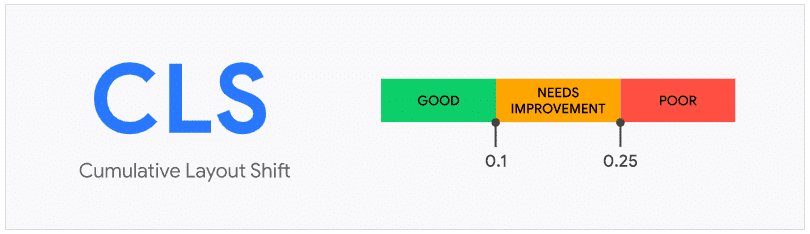
Cumulative Layout Shift (CLS)
CLS measures visual stability and the number of unexpected changes in the layout. Often times, the different elements that make up a website change location as the content loads, updates and materializes on the screen. These sudden changes are often annoying and lead to unwanted clicks in the wrong places, spoiling the browsing experience.
Unlike others, this metric does not measure time, but the frequency and magnitude of these changes. Each time such a change occurs, a value is added to the score, and it becomes more valuable the more the same element moves. Once the site is fully loaded, the values are added together, which would be your CLS score. For a good user experience, the score should be 0.1 or less.
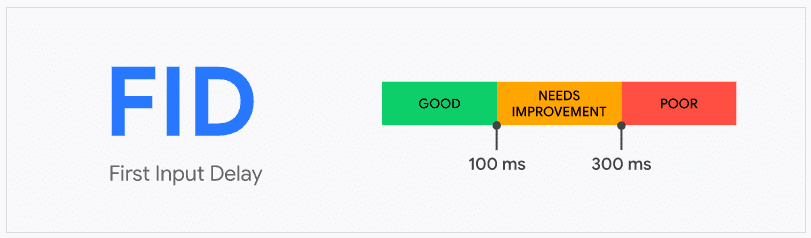
First Input Delay (FID)
It quantifies the experience by the ability to interact quickly, a.k.a., the responsiveness of the page.
How do you measure it? By calculating the time that goes by from the moment the user performs a certain action, such as a click, until the browser responds to that interaction. Surely it has happened to you, as it has to us, that you click on some function of the website and the page “freezes”, so to speak, until it actually displays the result of that action. That’s why it measures interactivity.
For a good user experience, the FID must be below 0.1 seconds, i.e. 100 milliseconds.
Creating your own website is no easy task (although we have this huge collection of useful web resources that can help you a lot). So imagine having worked so hard on your website, only for some details, which are actually pretty simple to improve, to be affecting your traffic.
When your website falls into the “good” category, you are giving a good user experience. And what does a good UX mean? That’s right! More visibility in the search engine. Boosting your SEO and landing into the first search options on Google is key to more users finding your site, otherwise, you’ll be forever stuck on the second page of Google -or as we call it, the best place to hide a body-.
Boosting your SEO and landing into the first search options on Google is key to more users finding your site.
Optimizing your website
Now that you know the importance of improving your Core Web Vitals for SEO, it’s time to learn how to optimize your website and make the most out of it.

There are a thousand and one methods to make your website lighter and greatly improve load time metrics, you can even find sets of WordPress plugins to revamp your Website’s SEO!
But in the case of Largest Contentful Paint (LCP), it can be affected by many factors such as slow response of servers and load times of all the resources on your page. So these are some of the best practices to optimize visual content and improve LCP score:
- Make your photos more efficient by using more modern file formats (AVIF, JPEG 200 or XL, and WebP).
- Compress images to reduce bandwidth, but make sure they look high quality.
- Use lazy loading.
- Use responsive images to make sure it loads well on all devices.
- Prefer videos instead of animated GIFs.
As you can see, the characteristics of the images and graphics you use on your website play a very important role in how fast your site loads. So, if at the moment you are not thinking twice about the type of file you use, and more importantly, the size, then your LCP score and SEO may be in trouble. Luckily for you, it’s never too late to correct this, we just need to start with the basics.
Vector vs Bitmap
Optimizing images for the web becomes an easy task when you learn to identify image formats and their intended use. But no matter the format, all computer graphic files fall into either one of two categories: bitmap graphics or vector graphics.
Let’s explore the 5 main differences between these two so we can get a grasp on how they operate on the web.
1. Composition
The major and most fundamental difference is that vector graphics are made up of basic geometric shapes, combining the use of points, lines and curves that rely on mathematical equations to generate a two-dimensional image. In contrast, bitmaps, also known as raster formats, are made up of multiple small colored dots called pixels that, placed in a specific layout, create a whole image.
Think of a painting made with complete brush strokes, this would be a vector graphic. While bitmaps can be compared to a painting made with pointillism.
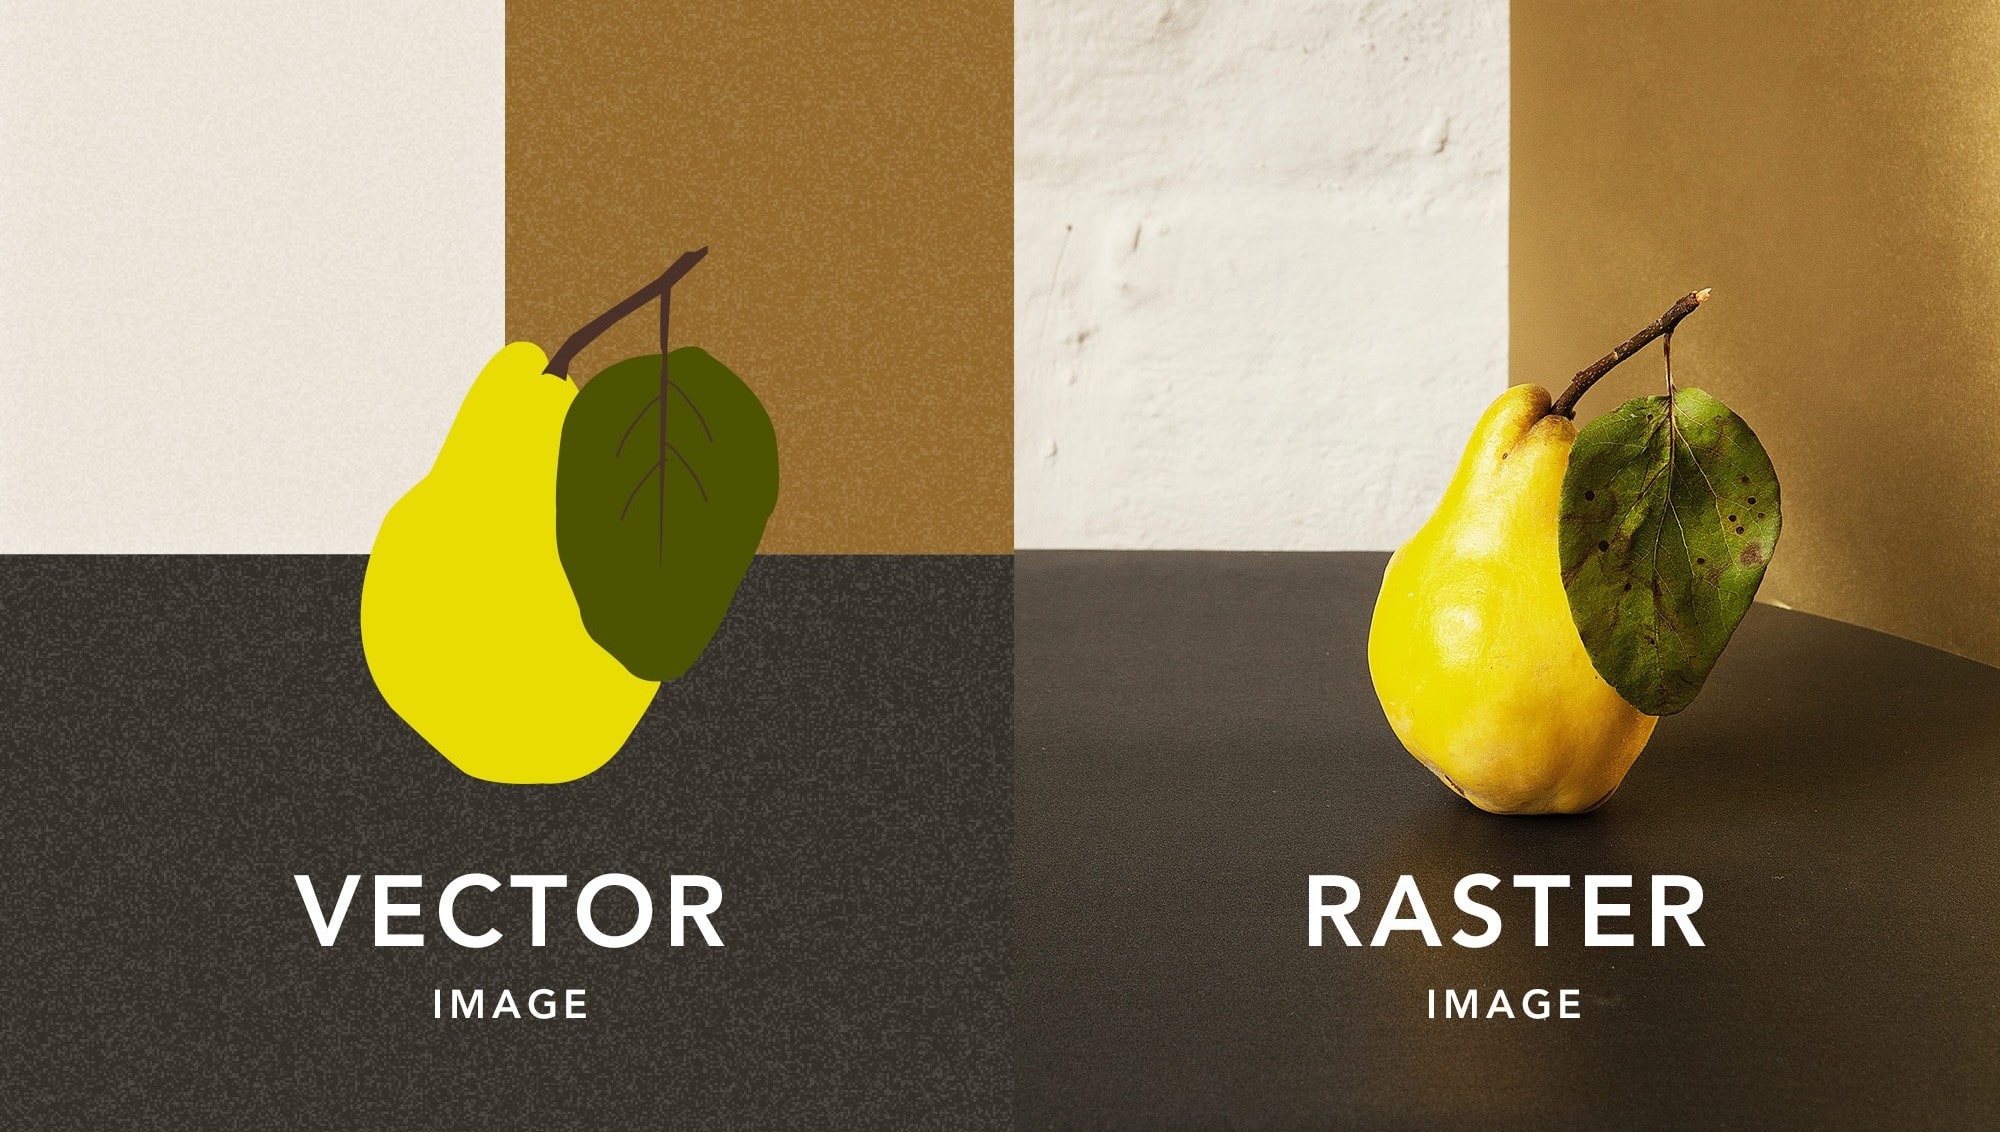 A side-by-side comparison of a vector image and a raster image
2. Resolution
One of the most common problems that designers often face is having to resize an image, but why is it such a stressful situation? Well, depending on the format, resizing tends to lower the quality of the image, negatively impacting the overall user experience
Bitmaps are resolution-dependent, this means that the quality of the image depends on preserving the resolution it was created. Since bitmap images are composed of a specific amount of pixels for their size, downsizing implies losing image information while enlarging the image implies revealing the pixels that make up the image, which causes pixelation. So, for the image to be at its best quality, it should be kept at its original size.
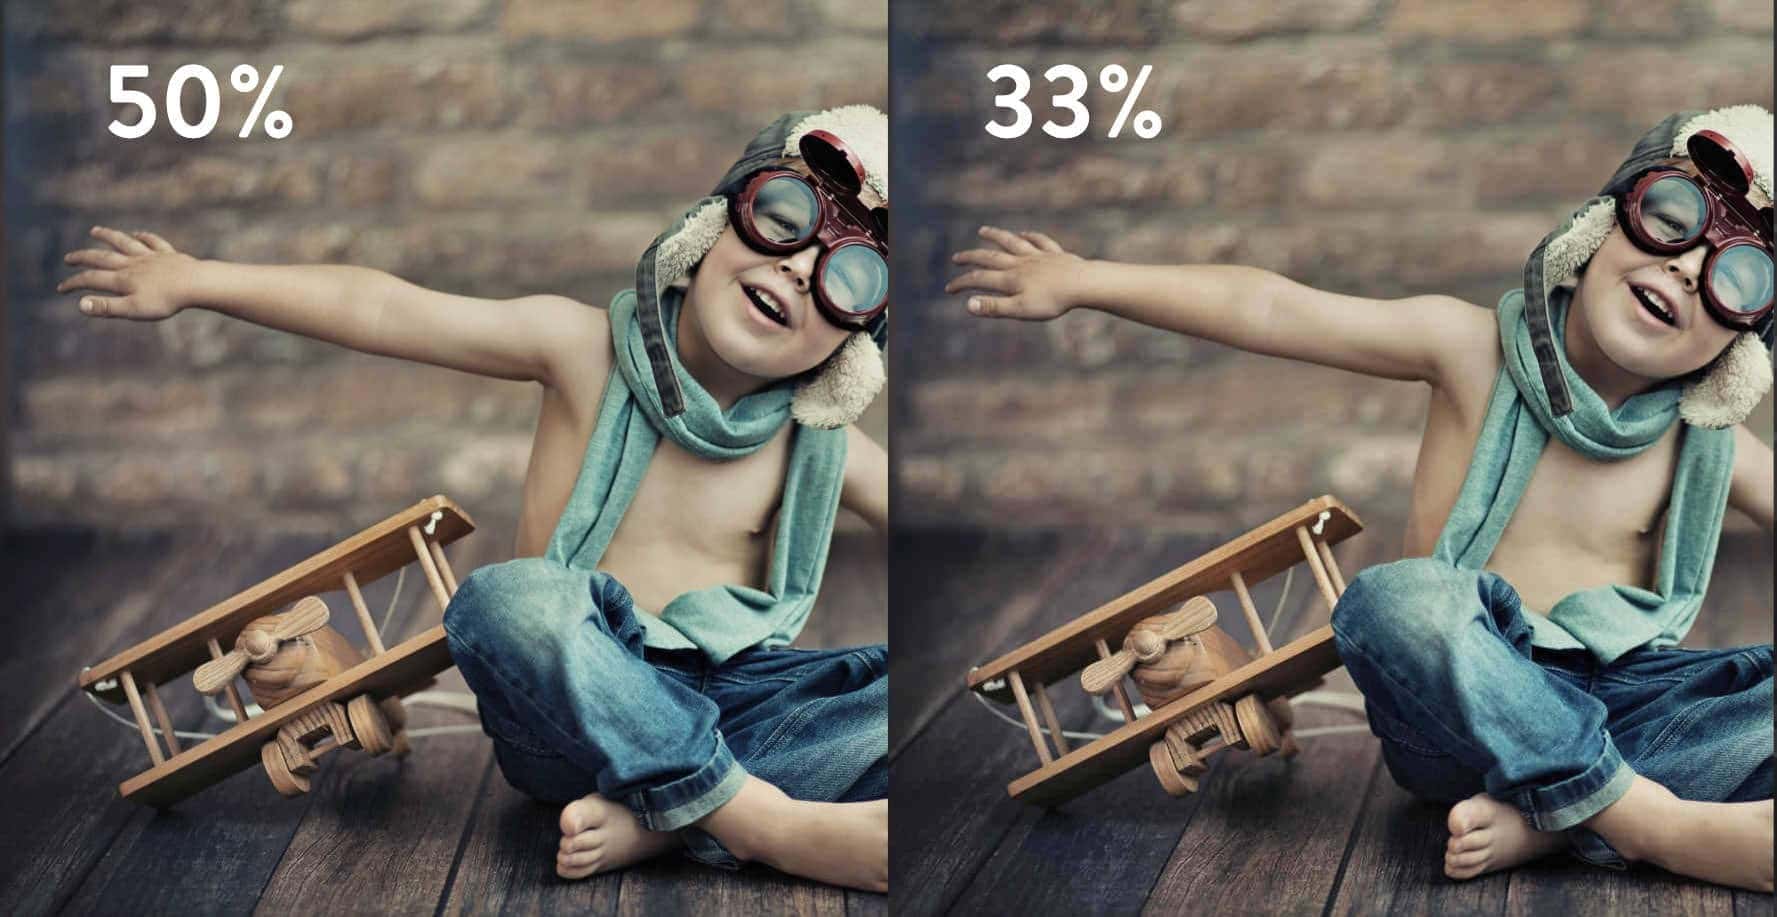
On the other hand, vectors will always maintain their quality as the graphics are made to adapt to the device upon which the image is displayed. The graphic below demonstrates how scaling up a raster leads to pixelation while a vector doesn’t.
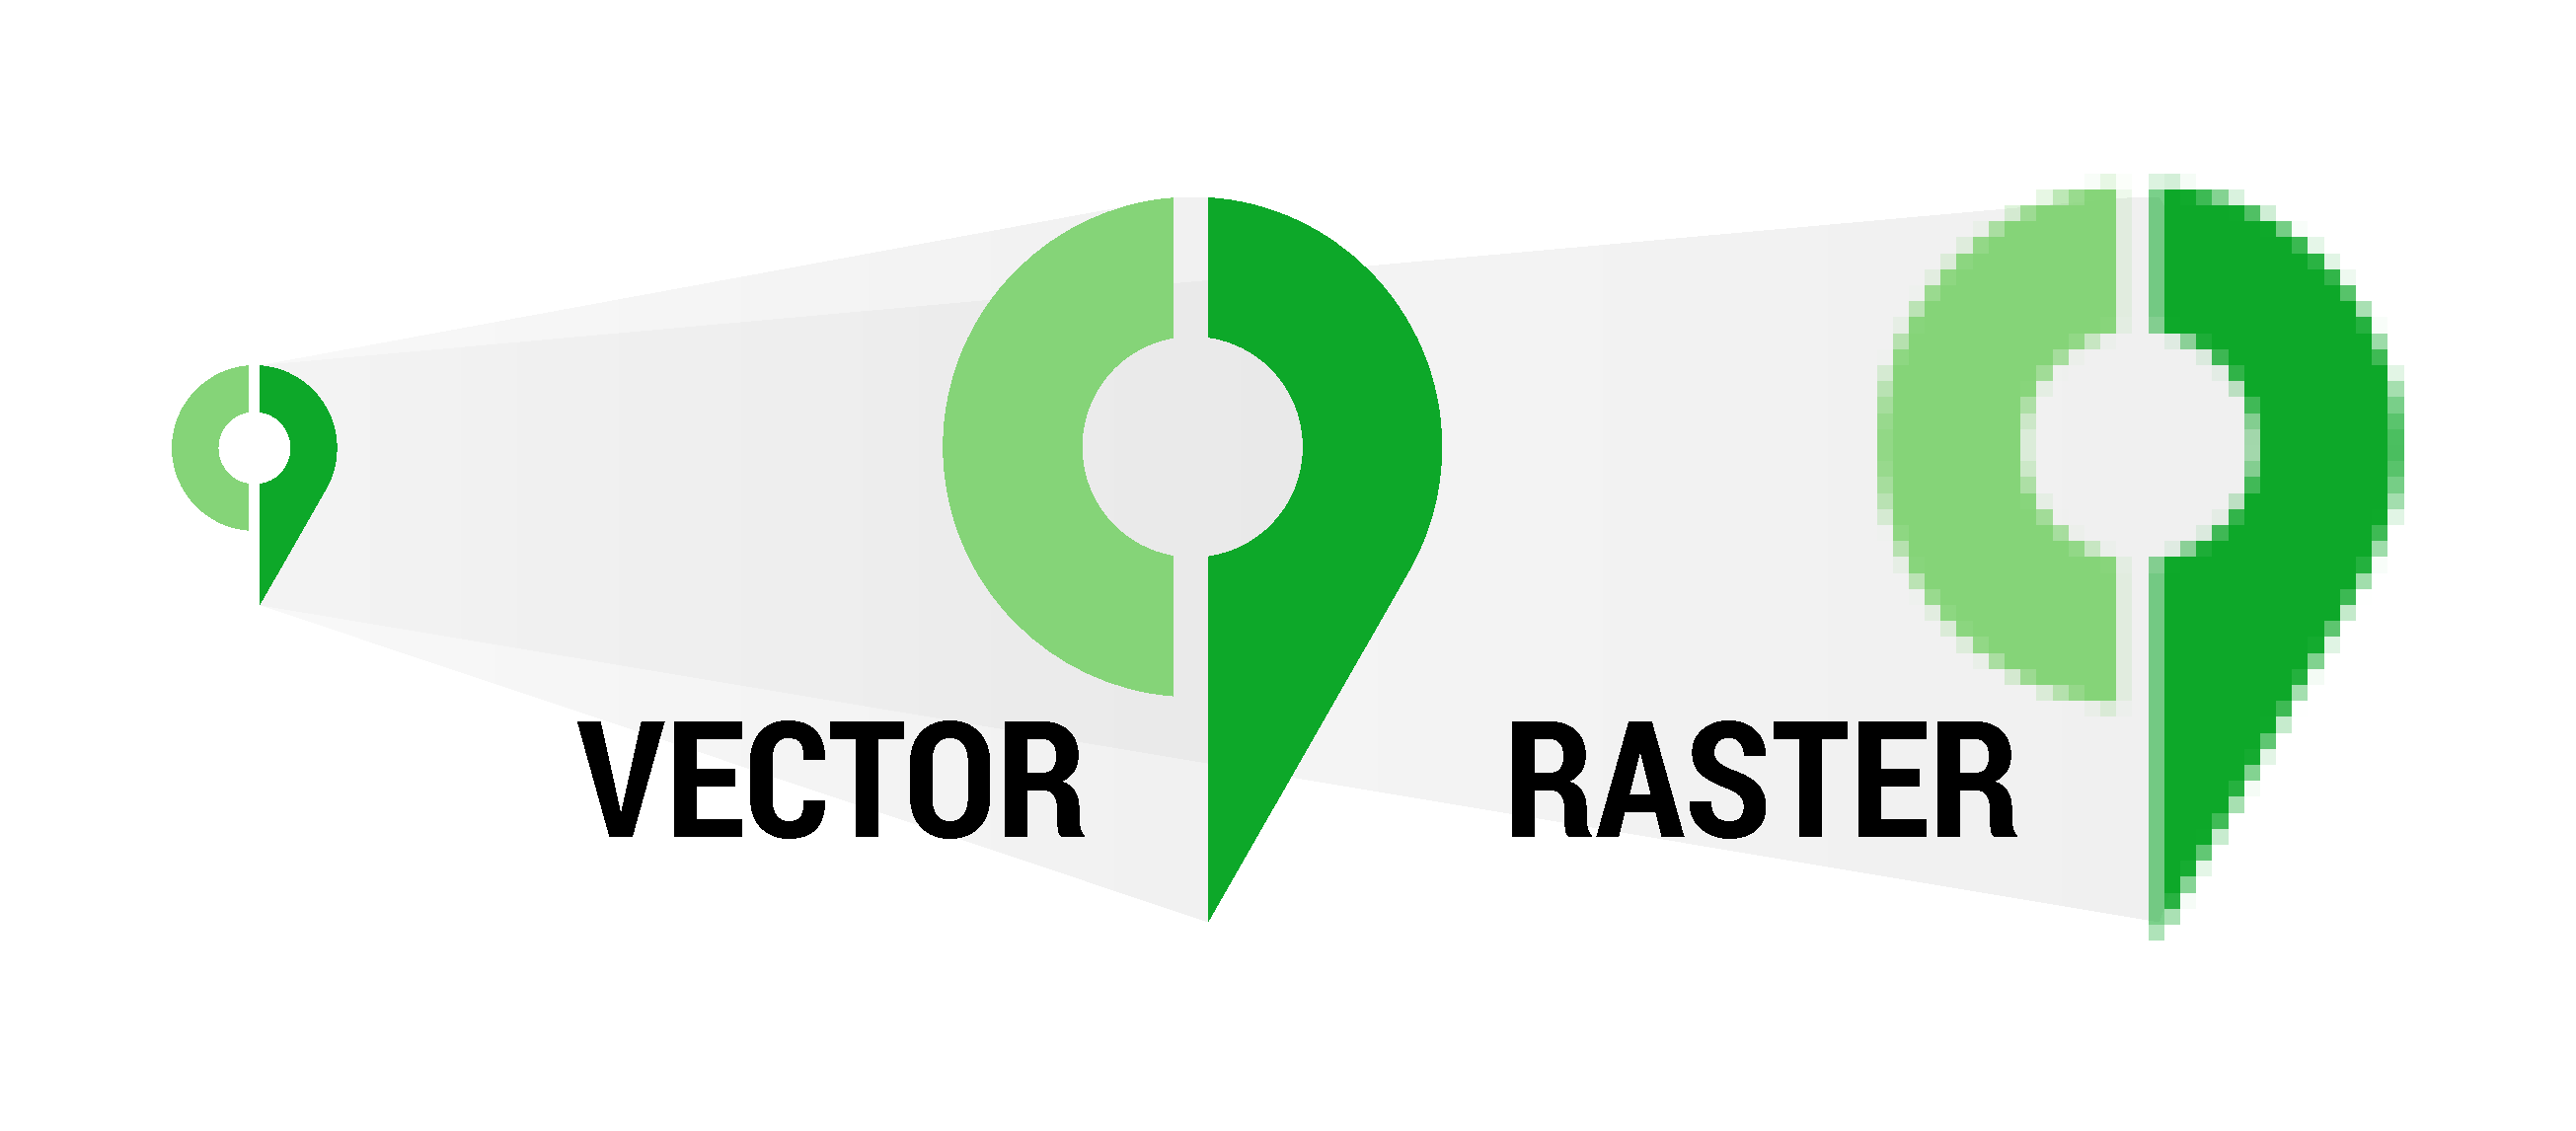
Notice how the pixels on the raster image deteriorate as we scale it up, while the vector image remains smooth
3. Format
Whether we are talking about vectors or bitmaps, each can be supported in different types of formats, each with its pros and cons depending on its use.
Vector-based formats:
- Scalable Vector Graphics (.svg): A SVG file is a vector image format commonly used on the web. It’s best suited for graphics that require consistent quality when scaled such as icons, banners, and charts while keeping a smaller file size than raster formats.
- Portable Document Format (.pdf): These are pdfs created with vectorial software such as Adobe Illustrator or Corel Draw —we’ll touch on that in a bit. The benefit of working with a vector PDF is that the elements remain sharp when you zoom in to see the details of the drawing.
- Encapsulated PostScript (.eps): EPS is often required for professional and high-quality image printing. PostScript printers and image setters typically use EPS to produce vast, detailed images such as billboard advertising and large posters.
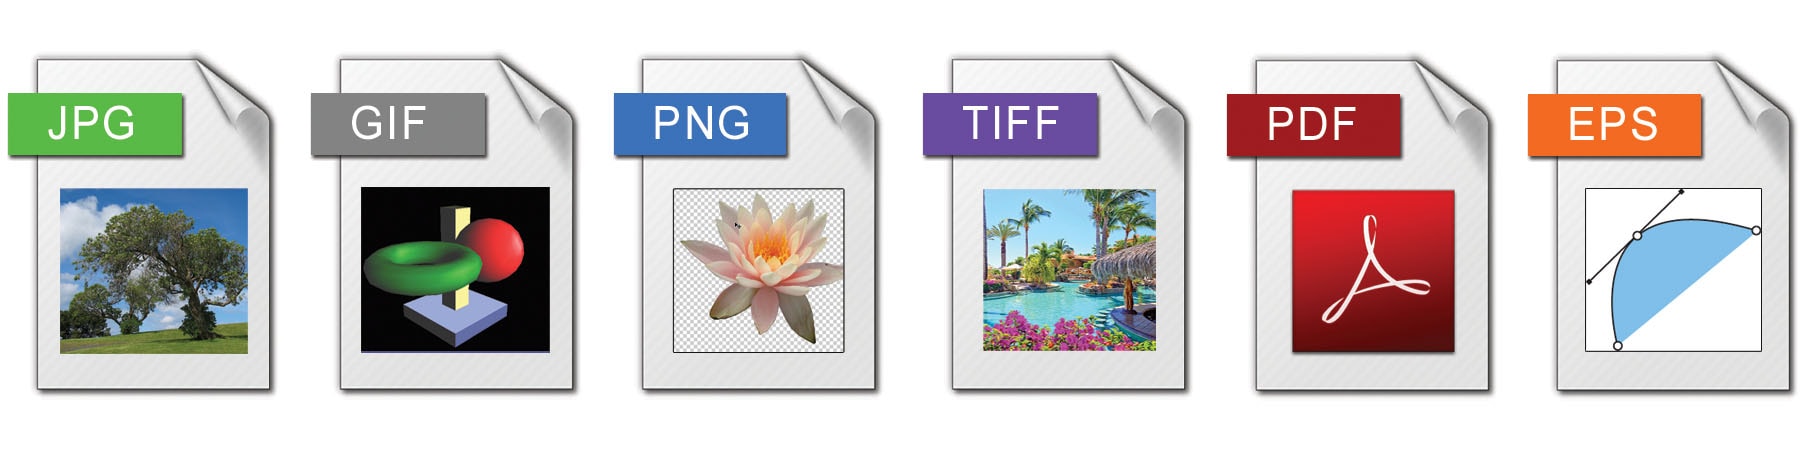
Pixel-based formats:
- Joint Photographic Experts Group – (.jpeg or .jpg, these are used interchangeably): It’s the most commonly used format for images and is excellent when used for photographs that are full of color. However, it is a lossy format, meaning that quality is lost whenever the image is resized.
- Portable Network Graphics – (.png): PNG images are standard on the web because they offer transparency: you can use a transparent PNG image to create the effect of depth and multiple layers. However, they tend to have larger file sizes than JPEGs and SVGs, making them less suitable for the web if you need a high-resolution image with smaller file size.
- Graphics Interchange Format – (.gif): GIF is most famous as the format for animated images, combining several images (or frames) played in succession into one file. With a GIF you could upload an animation to a page without needing a video player, however, if there are too many frames, the GIF will load slowly due to its larger file size.
- Tag Image File Format – (.tiff): This format is most popular among photographers, image editors, and publishers. It’s used for high-resolution graphics where file size is not a problem, so they aren’t typically supported in web browsers.
4. Usage
Vector formats such as SVG are the primary choice for logos, signs, icons, banners, infographics and clipart. One of its biggest pros for businesses is that with the versatility of creating vectors, it is possible to edit and quickly generate new ones to meet project requirements. For example, check out this pack of SVG Icons for the web that comes fully optimized and can also be customized.
Bitmaps, mostly JPG and PNG, are suitable for websites featuring products, restaurants, travel, tourism, and e-commerce because vibrant and colorful images are more visually appealing. Also, GIF files are perfect for cartoons and artwork animations.
Editing software
If you are looking to edit your image, in either vector or bitmap format, you can do so. The only thing you need to keep in mind is to use the right editing software.
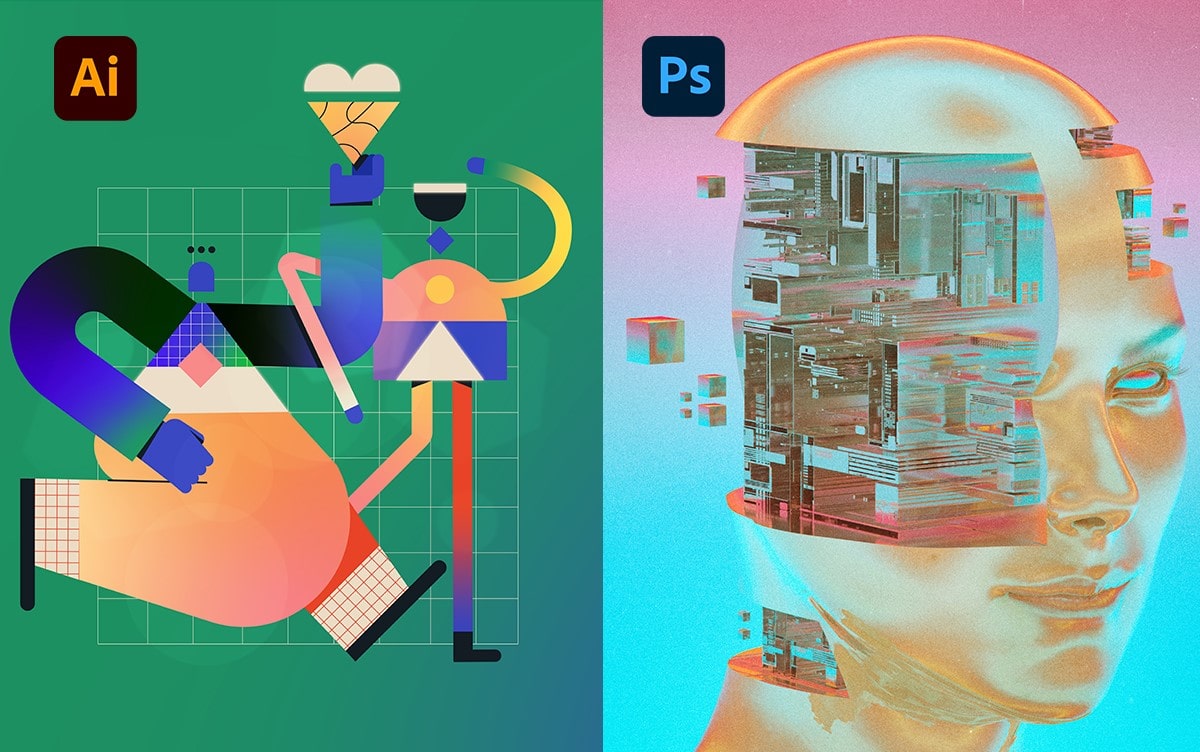
Vector graphics are edited by manipulating the lines and curves that make up the image using vector-based illustration software such as Adobe Illustrator, CorelDRAW, Affinity Designer, Inkscape, and many others (although Illustrator is the most widely used in the industry).
Bitmap images can be retouched and processed by erasing or changing the color of individual pixels using pixel-based image editing software such as Adobe Photoshop, Corel Painter, Affinity Photo, GIMP Krita, and Clip Studio Paint. And just like Illustrator, Photoshop is the most used overall.
These software can even be used to convert between formats. For example, Adobe Illustrator has some features that may be able to convert simple bitmap images to vector images —although, of course, not with the same fidelity and reality of a raster—; and vector images can be converted to bitmap images by opening them with Adobe Photoshop. However, converting a vector image to a bitmap image is rarely necessary, it removes the resolution quality factor of vector graphics and should only be done if you have a very specific reason to convert the graphic.
So, which of the two is better?
A simplified answer would be… neither! Before choosing one or the other, we recommend you evaluate the purpose for which you will use the image and where it will be displayed as this will determine the best option for you. To help you make the better choice, here are a few questions you should think about:
- Does the image need to be resized?
- Does the image need to look photo-realistic?
- Do you have any restrictions on file size?
- What are you using the image for?
&bnbsp;
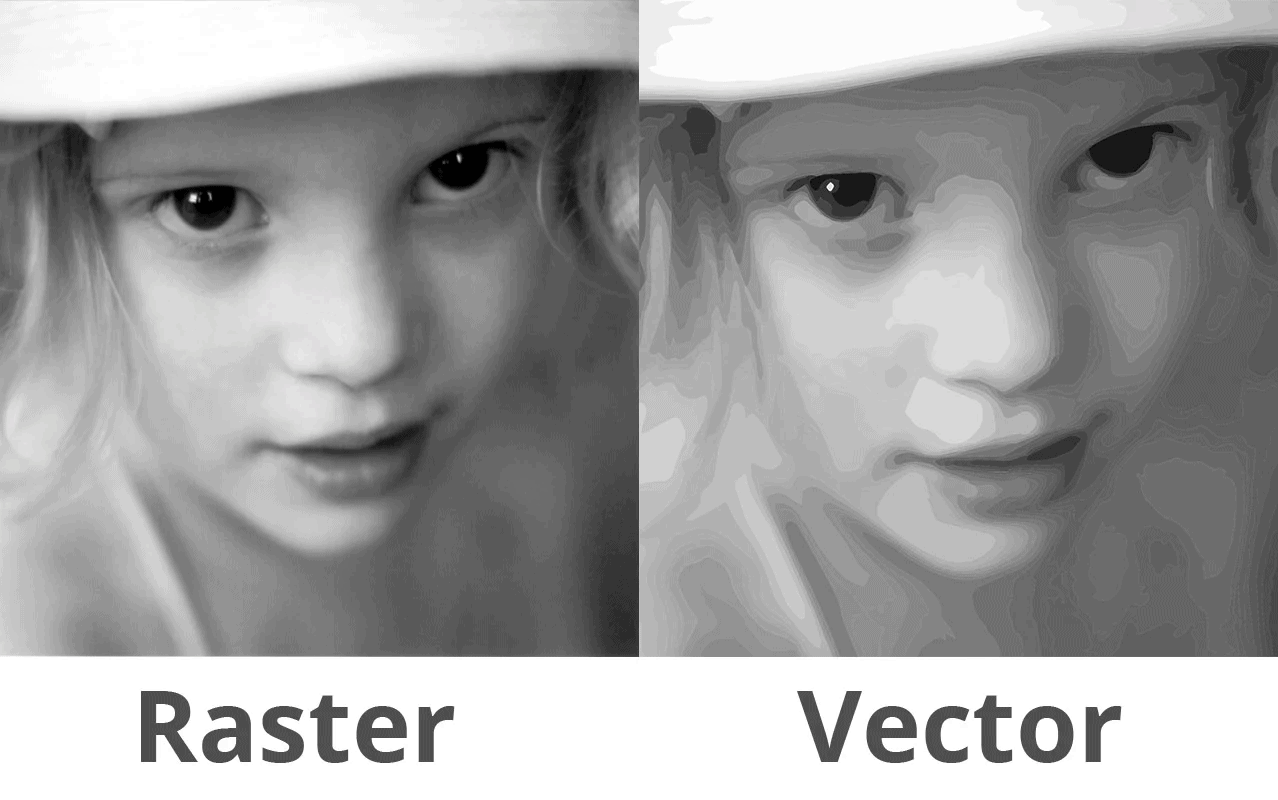
A side-by-side comparison of a raster image photo and a vectorized version of the same photo.
At first glance, you might think that, since vectors tend to maintain image quality at any size and can sometimes have a smaller file size compared to bitmap, then it is the better choice. However, raster formats are much more widely used for the web for two reasons:
- Rasters handle more efficient compression algorithms.
- When it comes to photographs, most of them are compatible with a larger number of browsers, unlike vector graphics that are supported by a few browsers (except for.SVG which is supported by nearly all browsers).
You should also bear in mind that most design projects involve a combination of vector and bitmap images, this is very common, especially in web design for which you can use check out many professional User Interfaces (UI) kits and web design packs. For example, you may use a vector logo whilst using bitmaps to store photos and other graphics.
So we do not want to prevent you from using one or the other; on the contrary, it’s a matter of evaluating the pros and cons according to what fits your project the best so that you can use them strategically to keep your website’s efficiency at 100%, ensuring a perfect experience for your users, and therefore, better statistics for you.
Time to optimize your images
Now that you have identified the image format you should use for your website, let’s dive into how to optimize your images and what tools you can use to improve your Web Vitals metrics.
Lossless vs Lossy Compression
Images need a large amount of data to be displayed, and to do so in its purest form is highly inefficient. For this reason, we use image optimization to deliver images in the smallest possible file size without reducing the overall image quality.
Images need a large amount of data to be displayed, and to do so in its purest form is highly inefficient.
Although it can be confusing to understand how data compression works, it’s actually something we do all the time when we use acronyms such as “ASAP” for “as soon as possible” that omit non-essential information. Data compression for the web can be done in many ways, but they all fit into one of these two categories: lossless or lossy.
Lossless compression algorithms work by encrypting the data at the sender and decrypting it at the receiver so that data is not permanently deleted and the file can be restored to its original form. Meanwhile, lossy compression works by deleting redundant information within a file that cannot be recovered; for example, if there are a bunch of unnoticeably off-white pixels in your image, it’s easier to change them to a full white that contains less information and the final user won’t notice any differences.
Manual optimization
One of the ways you can compress images is by using image editing software, most of them come with image optimization settings. This manual method is done with programs such as Adobe Photoshop for bitmaps and Illustrator for vector graphics.
Adobe Photoshop
One of the coolest things about this software is that it allows you to save images already optimized for web usage. How does it work? Once you have edited your image and are about to export it, you only have to click File > Save for Web and the following dialog box will show.
On the top right you will see different formats to choose from and desired quality options. Also, be sure to tick the “optimized” box. Once chosen, the final file size will be displayed at the bottom left.
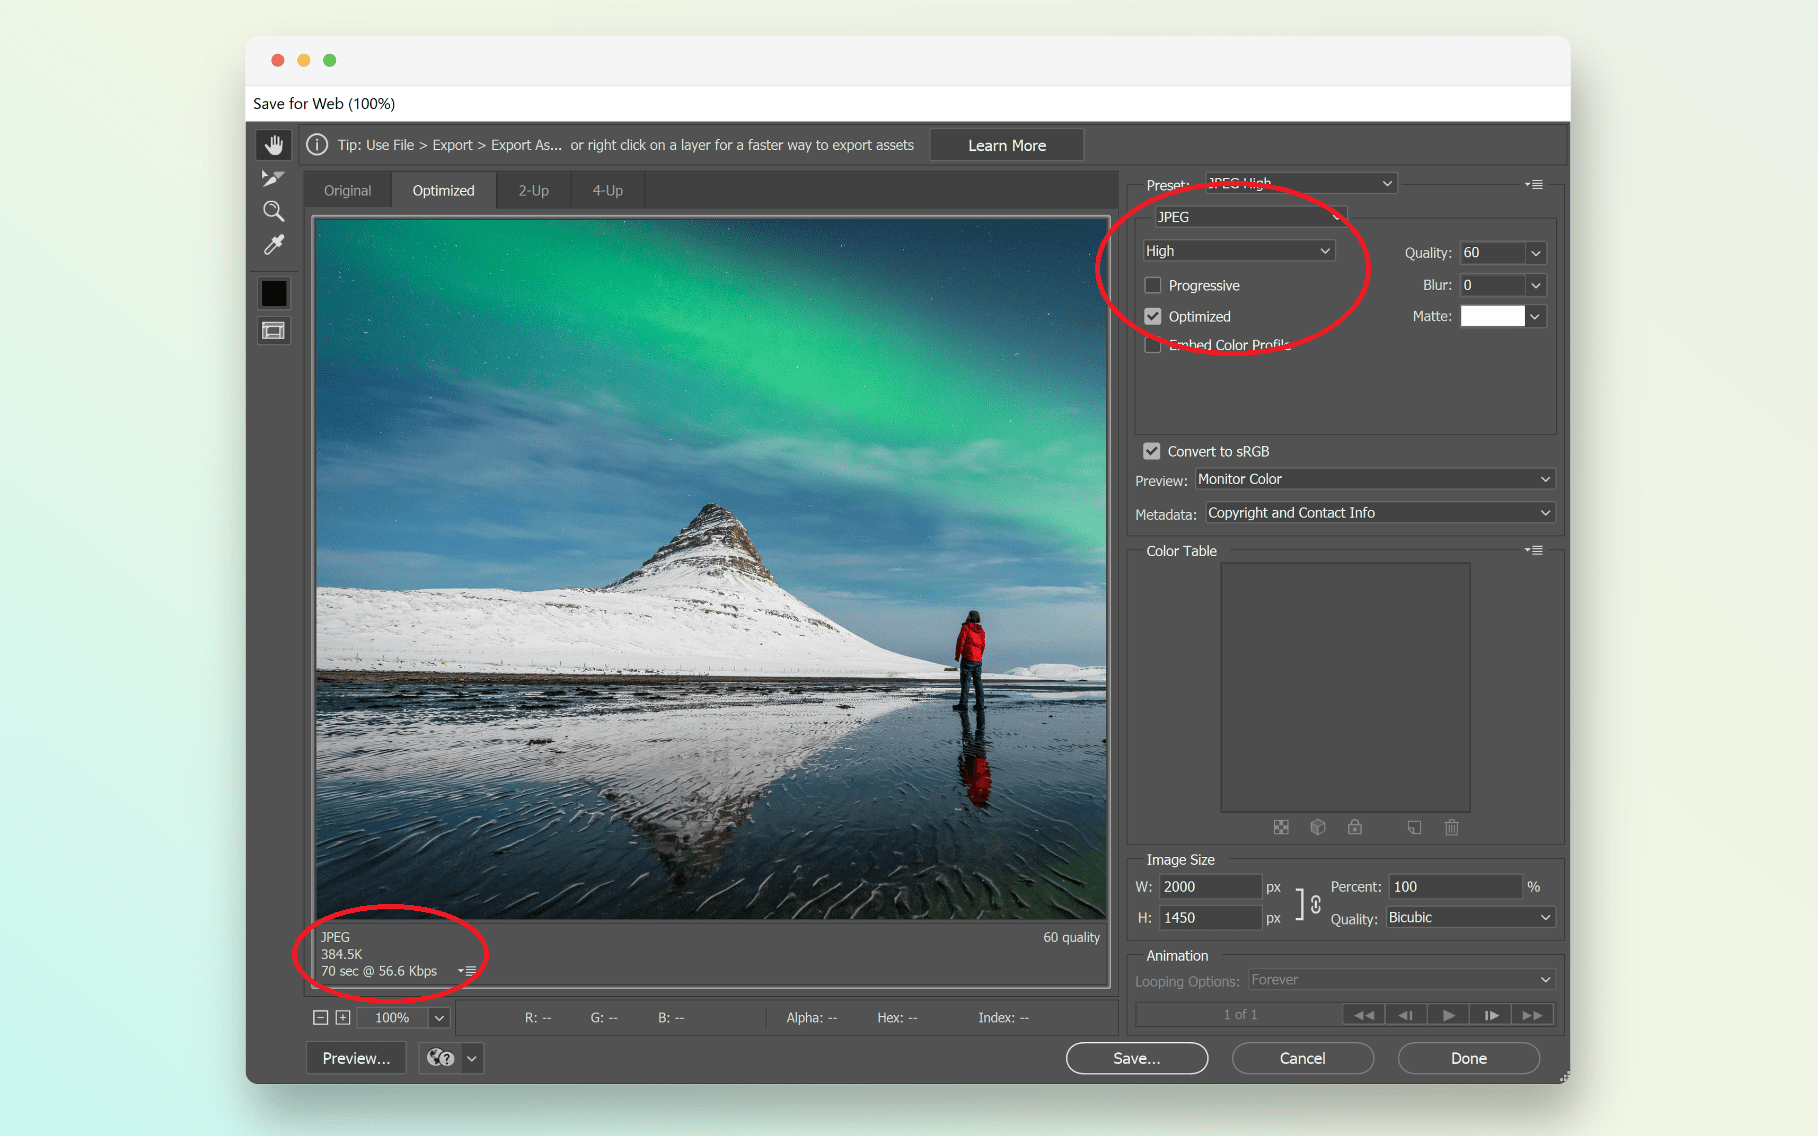
Export an image optimized for web, using the “save for web” legacy option in Adobe Photoshop
Adobe Illustrator
After you’re done creating your vectorial graphic and you are ready to save its final version, make sure to do it this way: go to File > Save or File > Save As, you’ll see the following options dialog box. To significantly reduce the file size, untick Create PDF Compatible File and tick Use Compression, like so:
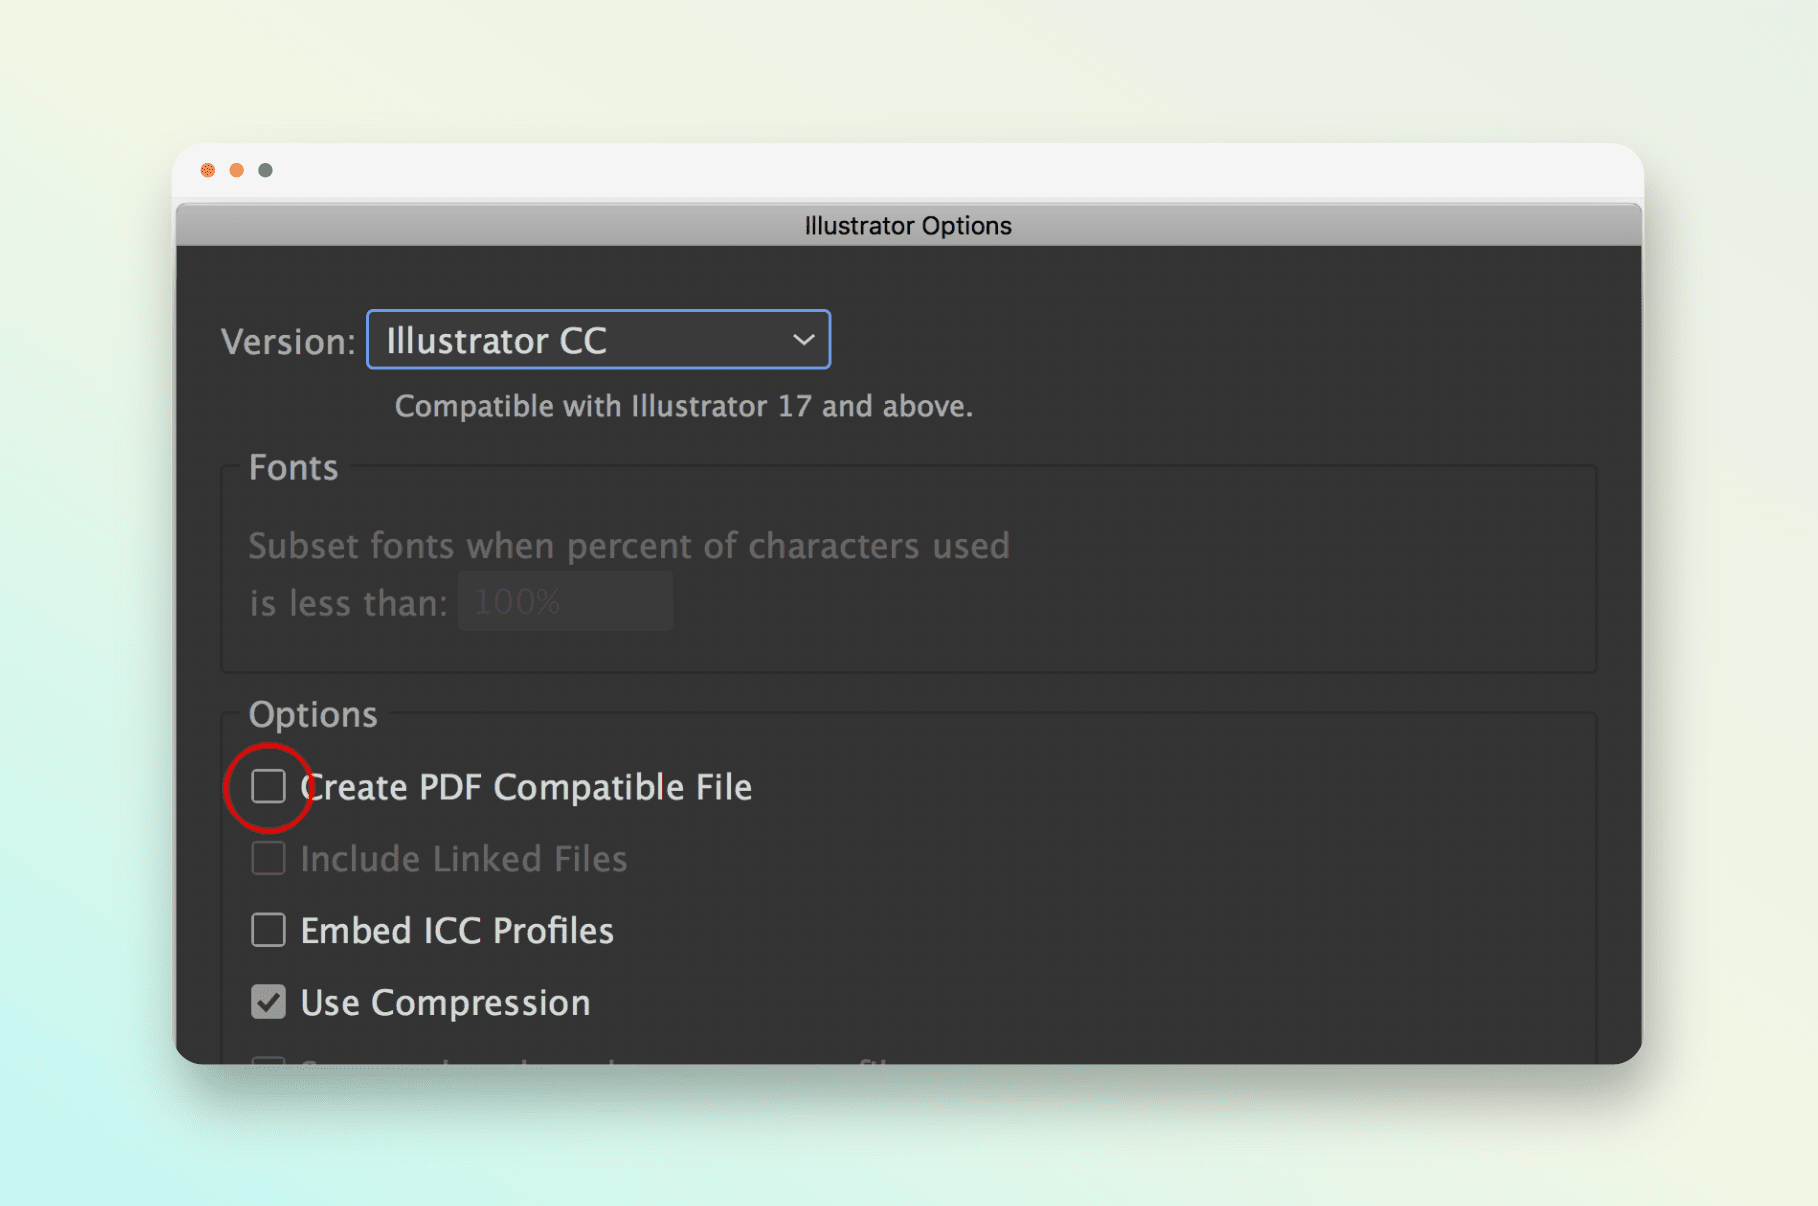
Exporting a vector image using Adobe Illustrator with optimal settings for file size reduction
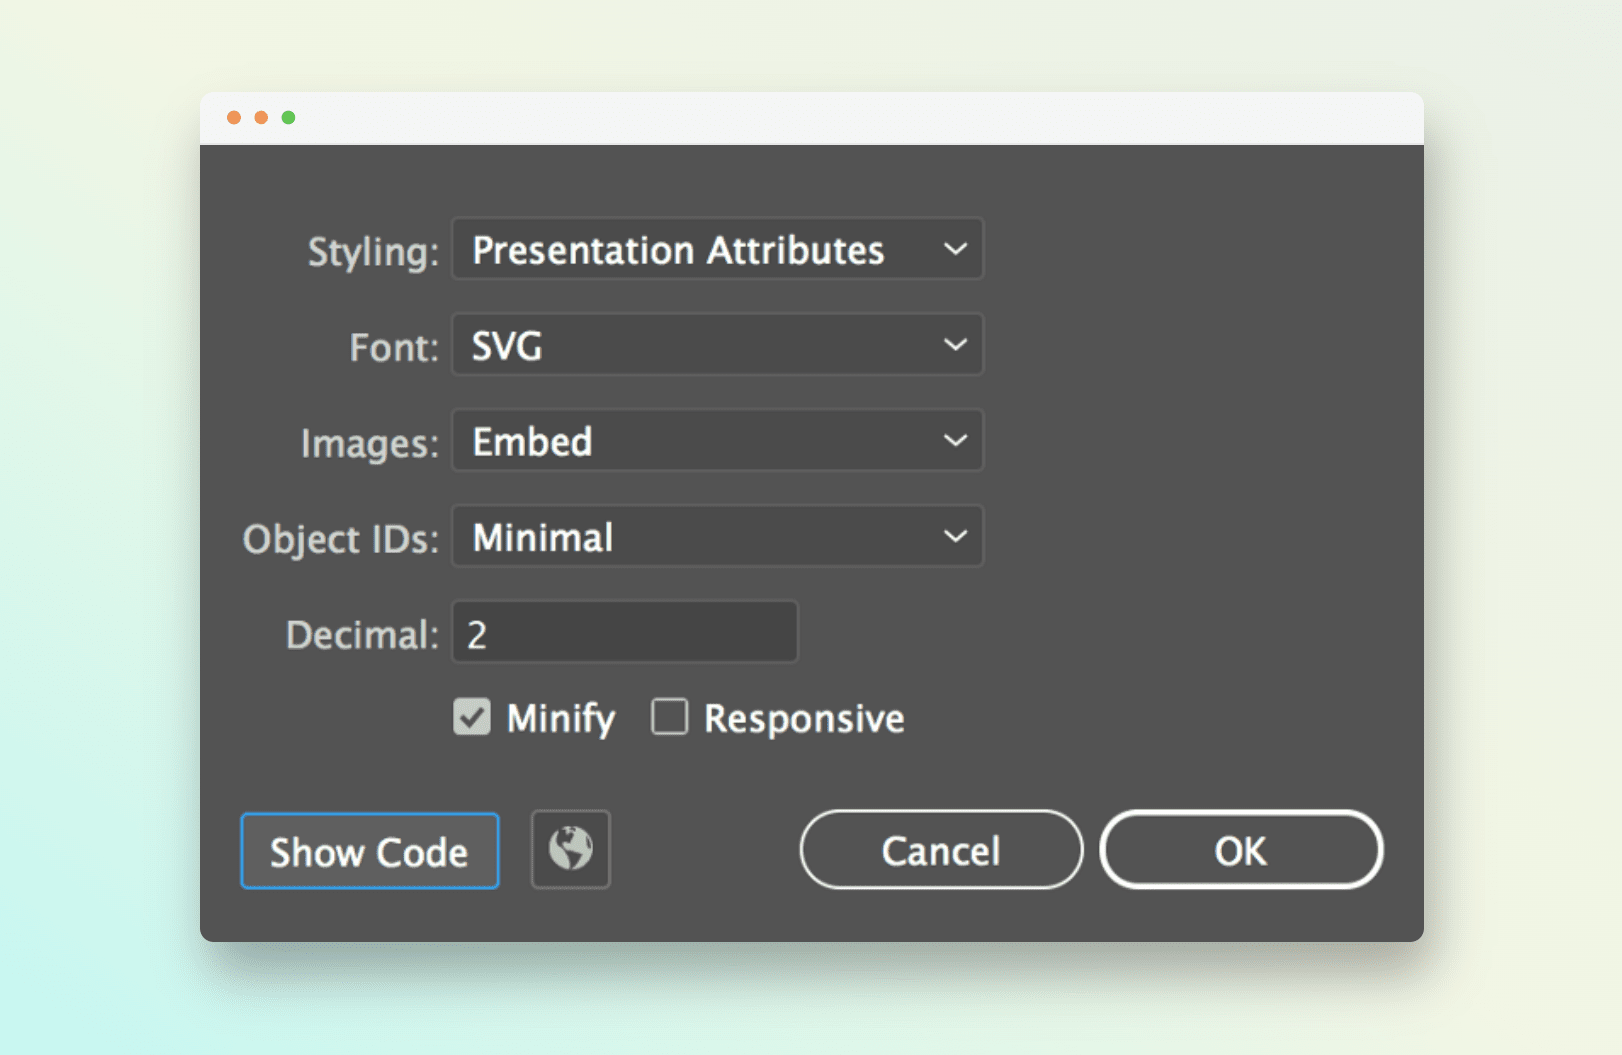
On the web, you will find resources that are already in SVG format such as this 100+ icon pack optimized for web usage. However, if you are looking to export your own file as an SVG with the best compression features, then you want to go with File > Export > Export As, name your file and choose SVG as the format. That opens a new window before the file saves.
In most cases, these will be the options you’ll want to check, mimic what you see here and you’ll be good to go:
Automated online optimization
Hands down this is the easiest and fastest way to optimize an image for web usage while maintaining pretty high image quality, as the manual method requires more time and precision, so if you’re in a rush, you could end up with a botched result.
There are multiple optimizers online that do the tough work of compressing images, however, not all of them do it comfortably and effectively, so that it doesn’t compromise your image. For this task we recommend to you our online compressor and converter: OptimizeImages, with 9 image optimization tools in one single toolkit that ensures the highest possible compression without loss of quality, removing pixels that are not essential to the image so it maintains its visual properties.
Side by side comparison of an image optimized using CreativeToolkit’s OptimizeImages tool.
And just like that, your images are ready to be used on your website! Another great option is to look for templates already optimized for the web, like this web banners bundle optimized for Google Ads so you only have to worry about adding the specific info of your business without thinking about optimization details.
After getting your website design right, you just need to use your optimized images and see how your metrics transform to give you the best SEO possible! This is how you can get the most out of the powerful resource that images are without compromising your Core Web Vitals and, even better, make sure that your users will come back every time to a great web experience.

Juan Pablo Sarmiento
System engineer from the National University of Colombia, with special interest over entrepreneurship, marketing, productivity and well-being.
Several projects and startups launched in over 20 years of experience.
Best Seller Deals
Check out time-limited deals on software and designs packs