This huge pack of premium UI Kits, Dashboards and Templates from Creative Tim features over 9.000 handcrafted components, 300+ customised plugins a...
This huge pack of premium UI Kits, Dashboards and Templates from Creative Tim features over 9.000 handcrafted components, 300+ customised plugins and 500+ example pages from 26 products products.
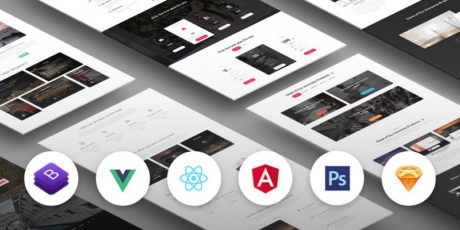
The package contains high quality code in HTML5 Bootstrap compatible with Bootstrap 3 & 4, Sass, Javascript & builds for Angular & Vue, working with all modern browsers like Chrome, FireFox, Edge, etc. Each product also includes PSD or Sketch files for designers, and are fully responsive & tested on MacOS, Windows & Ubuntu on different mobile devices, tablets, tvs & desktop computers.
You will get life-time access to all the products from the bundle with huge documentation and code examples.
Don't miss out on this one of a kind deal! Regularly priced $2,387, today you can get this entire web development pack for just $49
You Will Receive
26 Bootstrap templates & UI kits
Over 9k handcrafted components
311 customized plug-ins
524 example pages
Each product includes PSD or Sketch files
HTML Bootstrap, Javascript & Sass files
Compatible with Bootstrap 3 & 4
Javascript builds for Angular & Vue
Working with the latest modern browsers Chrome, Firefox, Opera, Edge
Fully responsive tested on MacOS, Windows, Ubuntu, on different devices, phones, tablets, desktops, TVs
Created with modern javascript frameworks Vue.js, React, Angular and jQuery
Huge Documentation with code examples
Get monthly updates with new products, freebies, tutorials and curated resources
Check Out The Contents!
This huge pack contains 26 products from creative tim, you can check out a short digest of contents below or head over to their website to see all the details & value this deal has to offer!
Get Shit Done Pro
Get Shit Done Kit Pro is a Bootstrap Kit that comes with a huge number of customisable components. They are not only designed to be pixel perfect and light but they are also easy to use and combine with other components.
Includes...
9000+ Bootstrap Components, 311 Customized Plugins, 520+ Example Pages
This huge pack of premium UI Kits, Dashboards and Templates from Creative Tim features over 9.000 handcrafted components, 300+ customised plugins and 500+ example pages from 26 products products.
The package contains high quality code in HTML5 Bootstrap compatible with Bootstrap 3 & 4, Sass, Javascript & builds for Angular & Vue, working with all modern browsers like Chrome, FireFox, Edge, etc. Each product also includes PSD or Sketch files for designers, and are fully responsive & tested on MacOS, Windows & Ubuntu on different mobile devices, tablets, tvs & desktop computers.
You will get life-time access to all the products from the bundle with huge documentation and code examples.
Don't miss out on this one of a kind deal! Regularly priced $2,387, today you can get this entire web development pack for just $49
You Will Receive
26 Bootstrap templates & UI kits
Over 9k handcrafted components
311 customized plug-ins
524 example pages
Each product includes PSD or Sketch files
HTML Bootstrap, Javascript & Sass files
Compatible with Bootstrap 3 & 4
Javascript builds for Angular & Vue
Working with the latest modern browsers Chrome, Firefox, Opera, Edge
Fully responsive tested on MacOS, Windows, Ubuntu, on different devices, phones, tablets, desktops, TVs
Created with modern javascript frameworks Vue.js, React, Angular and jQuery
Huge Documentation with code examples
Get monthly updates with new products, freebies, tutorials and curated resources
Check Out The Contents!
This huge pack contains 26 products from creative tim, you can check out a short digest of contents below or head over to their website to see all the details & value this deal has to offer!
Get Shit Done Pro
Get Shit Done Kit Pro is a Bootstrap Kit that comes with a huge number of customisable components. They are not only designed to be pixel perfect and light but they are also easy to use and combine with other components.
Includes:
15 Customized Plugins
160 Handcrafted Components
8 Example Pages
Material Kit PRO BS3
Start Your Development With A Badass Bootstrap 3 UI Kit inspired by Material Design. If you like Google's Material Design, you will love this kit! It features a huge number of components built to fit together and look amazing.
Includes:
7 Customized Plugins
1000 Handcrafted Components
11 Example Pages
Rubik Presentation Page
Rubik - bootstrap presentation page, is a collection of elements that helps you create a beautiful and stylish presentation page for your company, agency, personal portfolio or startup. It is built on top of twitter Bootstrap and styled to look amazingly beautiful.
Includes:
5 Customized Plugins
47 Handcrafted Components
4 Example Pages
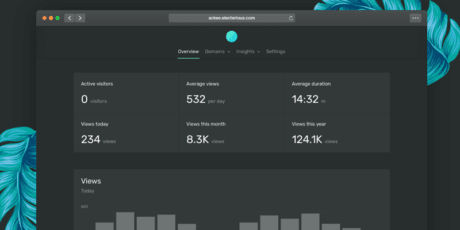
Material Dashboard Pro React
Material Dashboard PRO React is a Premium Material-UI Admin with a fresh, new design inspired by Google's Material Design. We are very excited to introduce our take on the material concepts through an easy to use and beautiful set of components.
Includes:
10 Customized Plugins
200 Handcrafted Components
28 Example Pages
Vue Material Dashboard PRO
Vue Material Dashboard PRO is a beautiful resource built over Vue Material and Vuejs. It will help you get started developing dashboards in no time. Vue Material Dashboard PRO is the official Vuejs version of the Original Material Dashboard PRO.
Includes:
15 Customized Plugins
200 Handcrafted Components
27 Example Pages
Paper Kit Pro
Paper Kit PRO is a set of coded web components built over Bootstrap, having a design that resembles paper. The kit comes with a huge number of customisable components. They are designed to look great together, following the same design pattern. Transitions, shadows,...
Includes:
12 Customized Plugins
161 Handcrafted Components
13 Example Pages
Vue Light Bootstrap Dashboard PRO
Vue Light Bootstrap Dashboard PRO is a Bootstrap 4 Admin Template designed to be beautiful and simple. It is built on top of Bootstrap 4 and Vuejs and it is fully responsive.
Includes:
17 Customized Plugins
160 Handcrafted Components
25 Example Pages
Material Dashboard Pro BS3
Material Dashboard PRO is a Premium Material Bootstrap 3 Admin with a fresh, new design inspired by Google's Material Design.
Includes:
15 Customized Plugins
200 Handcrafted Components
27 Example Pages
Gaia Bootstrap Template Pro
Gaia is a multi-page Bootstrap Template designed to be easy to use and stylish. If you are trying to create a new website, presentation page or blog, this is definitely a great fit for you. It offers 9 example pages with multiple sections that look amazing in any...
Includes:
3 Customized Plugins
60 Handcrafted Components
9 Example Pages
Light Bootstrap Dashboard PRO React
Light Bootstrap Dashboard PRO React is a premium admin dashboard template designed to be beautiful and simple. It is built on top of React Bootstrap, using Light Bootstrap Dashboard PRO.
Includes:
13 Customized Plugins
60 Handcrafted Components
24 Example Pages
Paper Dashboard 2 PRO
Paper Dashboard 2 PRO is a beautiful Bootstrap 4 admin dashboard with a large number of components, designed to look neat and organized. If you are looking for a tool to manage and visualize data about your business, this dashboard is the thing for you.
Includes:
13 Customized Plugins
160 Handcrafted Components
24 Example Pages
Now UI Dashboard PRO
Now UI Dashboard PRO is a beautiful Bootstrap 4 admin dashboard with a large number of components, designed to look beautiful, clean and organized. If you are looking for a tool to manage dates about your business, this dashboard is the thing for you.
Includes:
13 Customized Plugins
160 Handcrafted Components
28 Example Pages
Material Dashboard Pro Angular
Material Dashboard PRO Angular 7 is a Premium Material Bootstrap 4 Admin for Angular 7 framework, with a fresh, new design inspired by Google's Material Design.
Includes:
15 Customized Plugins
200 Handcrafted Components
27 Example Pages
Paper Dashboard Pro
Paper Dashboard PRO is a beautiful Bootstrap admin dashboard with a large number of components, designed to look neat and organised.
Includes:
15 Customized Plugins
160 Handcrafted Components
25 Example Pages
Now UI Kit PRO
Now UI Kit PRO is a premium Bootstrap 4 kit provided by Invision and Creative Tim. It is a beautiful cross-platform UI kit featuring over 1000 components, 34 sections and 11 example pages.
Includes:
7 Customized Plugins
1000 Handcrafted Components
11 Example Pages
Material Dashboard Pro
Material Dashboard PRO is a Premium Material Bootstrap 4 Admin with a fresh, new design inspired by Google's Material Design.
Includes:
15 Customized Plugins
200 Handcrafted Components
27 Example Pages
Now UI Dashboard PRO React
Now UI Dashboard PRO React is a beautiful Bootstrap 4 admin dashboard that uses reactstrap (https://reactstrap.github.io/) with a large number of components, designed to look beautiful, clean and organized. If you are looking for a tool to manage and visu
Includes:
13 Customized Plugins
160 Handcrafted Components
27 Example Pages
Paper Kit 2 PRO
Paper Kit 2 PRO is a premium Bootstrap 4 UI Kit with a huge number of components, sections and example pages.
Includes:
7 Customized Plugins
1000 Handcrafted Components
15 Example Pages
Now UI Kit PRO Angular
Now UI Kit PRO Angular is a premium Bootstrap 4 UI Kit built on top of Angular 7 with a huge number of components, sections and example pages. All the components are designed to look great together, following the same design pattern. Any elements that are
Includes:
8 Customized Plugins
1000 Handcrafted Components
11 Example Pages
Light Bootstrap Dashboard Pro
Light Bootstrap Dashboard PRO is a Bootstrap 4 Admin Theme designed to look simple and beautiful. Forget about boring dashboards and grab yourself a copy to kickstart new project! It is the easiest way to save time and money for your development.
Includes:
15 Customized Plugins
120 Handcrafted Components
24 Example Pages
Light Bootstrap Dashboard Pro Angular
Light Bootstrap Dashboard Pro Angular is an admin dashboard template designed to be beautiful and simple. It is fully responsive and built on top of Bootstrap and Angular.
Includes:
15 Customized Plugins
120 Handcrafted Components
24 Example Pages
Paper Kit 2 PRO Angular
Paper Kit 2 PRO Angular is a premium Bootstrap 4 UI Kit with a huge number of components, sections and example pages.
Includes:
9 Customized Plugins
1000 Handcrafted Components
18 Example Pages
Paper Dashboard Pro Angular
Paper Dashboard PRO Angular is a simple and beautiful Bootstrap admin dashboard with a large number of components. If you are looking for a tool to manage and visualise data about your business, this dashboard is the thing for you.
Includes:
15 Customized Plugins
160 Handcrafted Components
25 Example Pages
Vue Now UI Dashboard PRO
Vue Now UI Dashboard PRO is a Bootstrap 4 Admin Template designed to be beautiful and simple. It is built on top of Bootstrap 4 and Vuejs and it is fully responsive.
Includes:
17 Customized Plugins
160 Handcrafted Components
27 Example Pages
Vue Paper Dashboard PRO
Vue Paper Dashboard PRO is a beautiful resource built over Bootstrap and Vue. It will help you get started developing dashboards in no time. Vue Paper Dashboard PRO is a Vue ported version of the HTML version.
Includes:
15 Customized Plugins
160 Handcrafted Components
25 Example Pages
Material Kit Pro
Start Your Development With A Badass Bootstrap 4 UI Kit inspired by Material Design. If you like Google's Material Design, you will love this kit! It features a huge number of components built to fit together and look amazing.
Includes:
7 Customized Plugins
1000 Handcrafted Components
11 Example Pages
(Back To Top)