Infographic Design Templates: The Best Elements and Infographic Packs to Use
In today’s world, with so much data being produced and consumed, it can be tough to make sense of it all. This is where infographics can be a game-changer. They are an incredibly useful visual tool that can take complex information and present it in a clear and easy-to-understand way. While graphic designers are often who create infographics, you don’t have to be one to make an effective one. There are many online bundles available for anyone to use.
Since school days, this type of design has been used to summarize information and make it visually more appealing. I can’t recall a moment when I haven’t had to create an infographic for something academic; they have always been a fundamental tool in learning.
Now that I’m not as much in the academic realm, I use them to send important information to the employees of the company where I work, whether it’s for monthly reports, accounts, statistics, reports, among others. Likewise, using infographic templates is the easiest and quickest way to execute designs.
Nowadays, you don’t need to be a perfect designer to create a high-quality infographic; you can do it on various platforms that offer pre-designed templates on different topics and simply add your text creatively.
That’s why in this article we will be sharing different packages and templates that can help you create the perfect infographic for your project.
What are Infographics
Infographics are graphic representations that combine images, graphs, tables, text and many more elements, in a certain way that conveys information concisely and effectively. They are so effective that many professional fields use them constantly to display their own information, like doctors, lawyers, journalists, teachers, students and even business workers!
Infographics can condense a ton of information into just one space. This makes them perfect for summarizing and explaining complicated concepts in a simple way. Even though infographics can look different from one another, they usually include common elements that help present information in a clear and effective manner:
- Title: It is the heading that summarizes the main topic of the infographic.
- Introduction: A brief introduction that explains the topic to be discussed.
- Data and statistics: The numerical, statistical or factual information that you want to present.
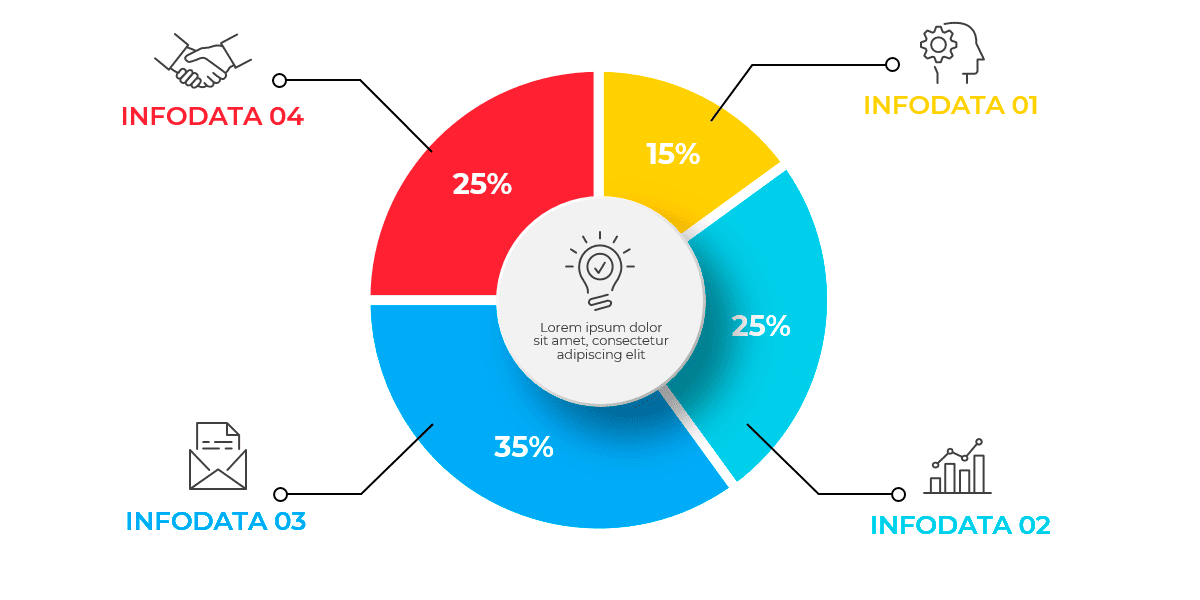
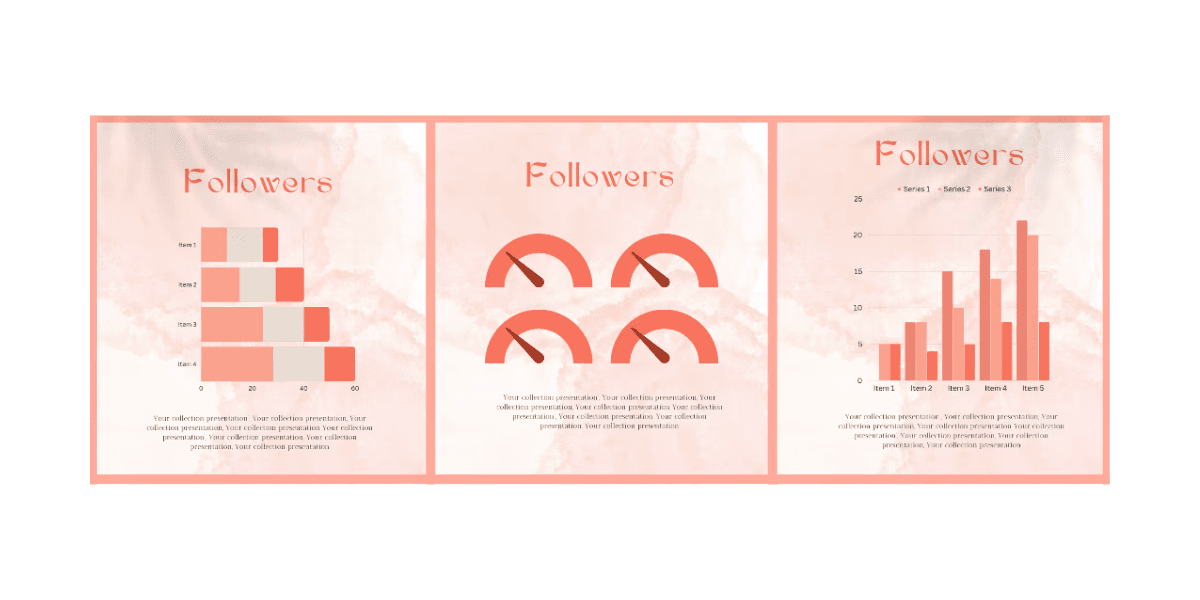
- Charts and Tables: Visual elements that help present data clearly and effectively, such as bar charts, pie charts, line charts, tables, etc.
If you want to create stunning infographics complete with eye-catching charts and tables, look no further than the 15K infographic elements and presentation slides megabundle! With a whopping 15,000 customizable vector icons and elements, you can easily create beautiful and professional designs for your presentations, reports, or any other project.
Importance of Elements and Templates when Creating Effective Infographics
A few days ago, a coworker who didn’t know much about design had to create an infographic to summarize a report that had been requested. Not knowing about design, the easiest and most practical thing to do was to use a ready-made template, but she didn’t know where to find one.
As a personal matter, I recommended the ones we can find on ByPeople, as they are modern and formal, just what she was looking for. She chose the template she considered best for her infographic and received praise from her boss, as she surpassed a challenge she thought she wouldn’t achieve because she didn’t know how to design. That’s how practical infographic templates become.
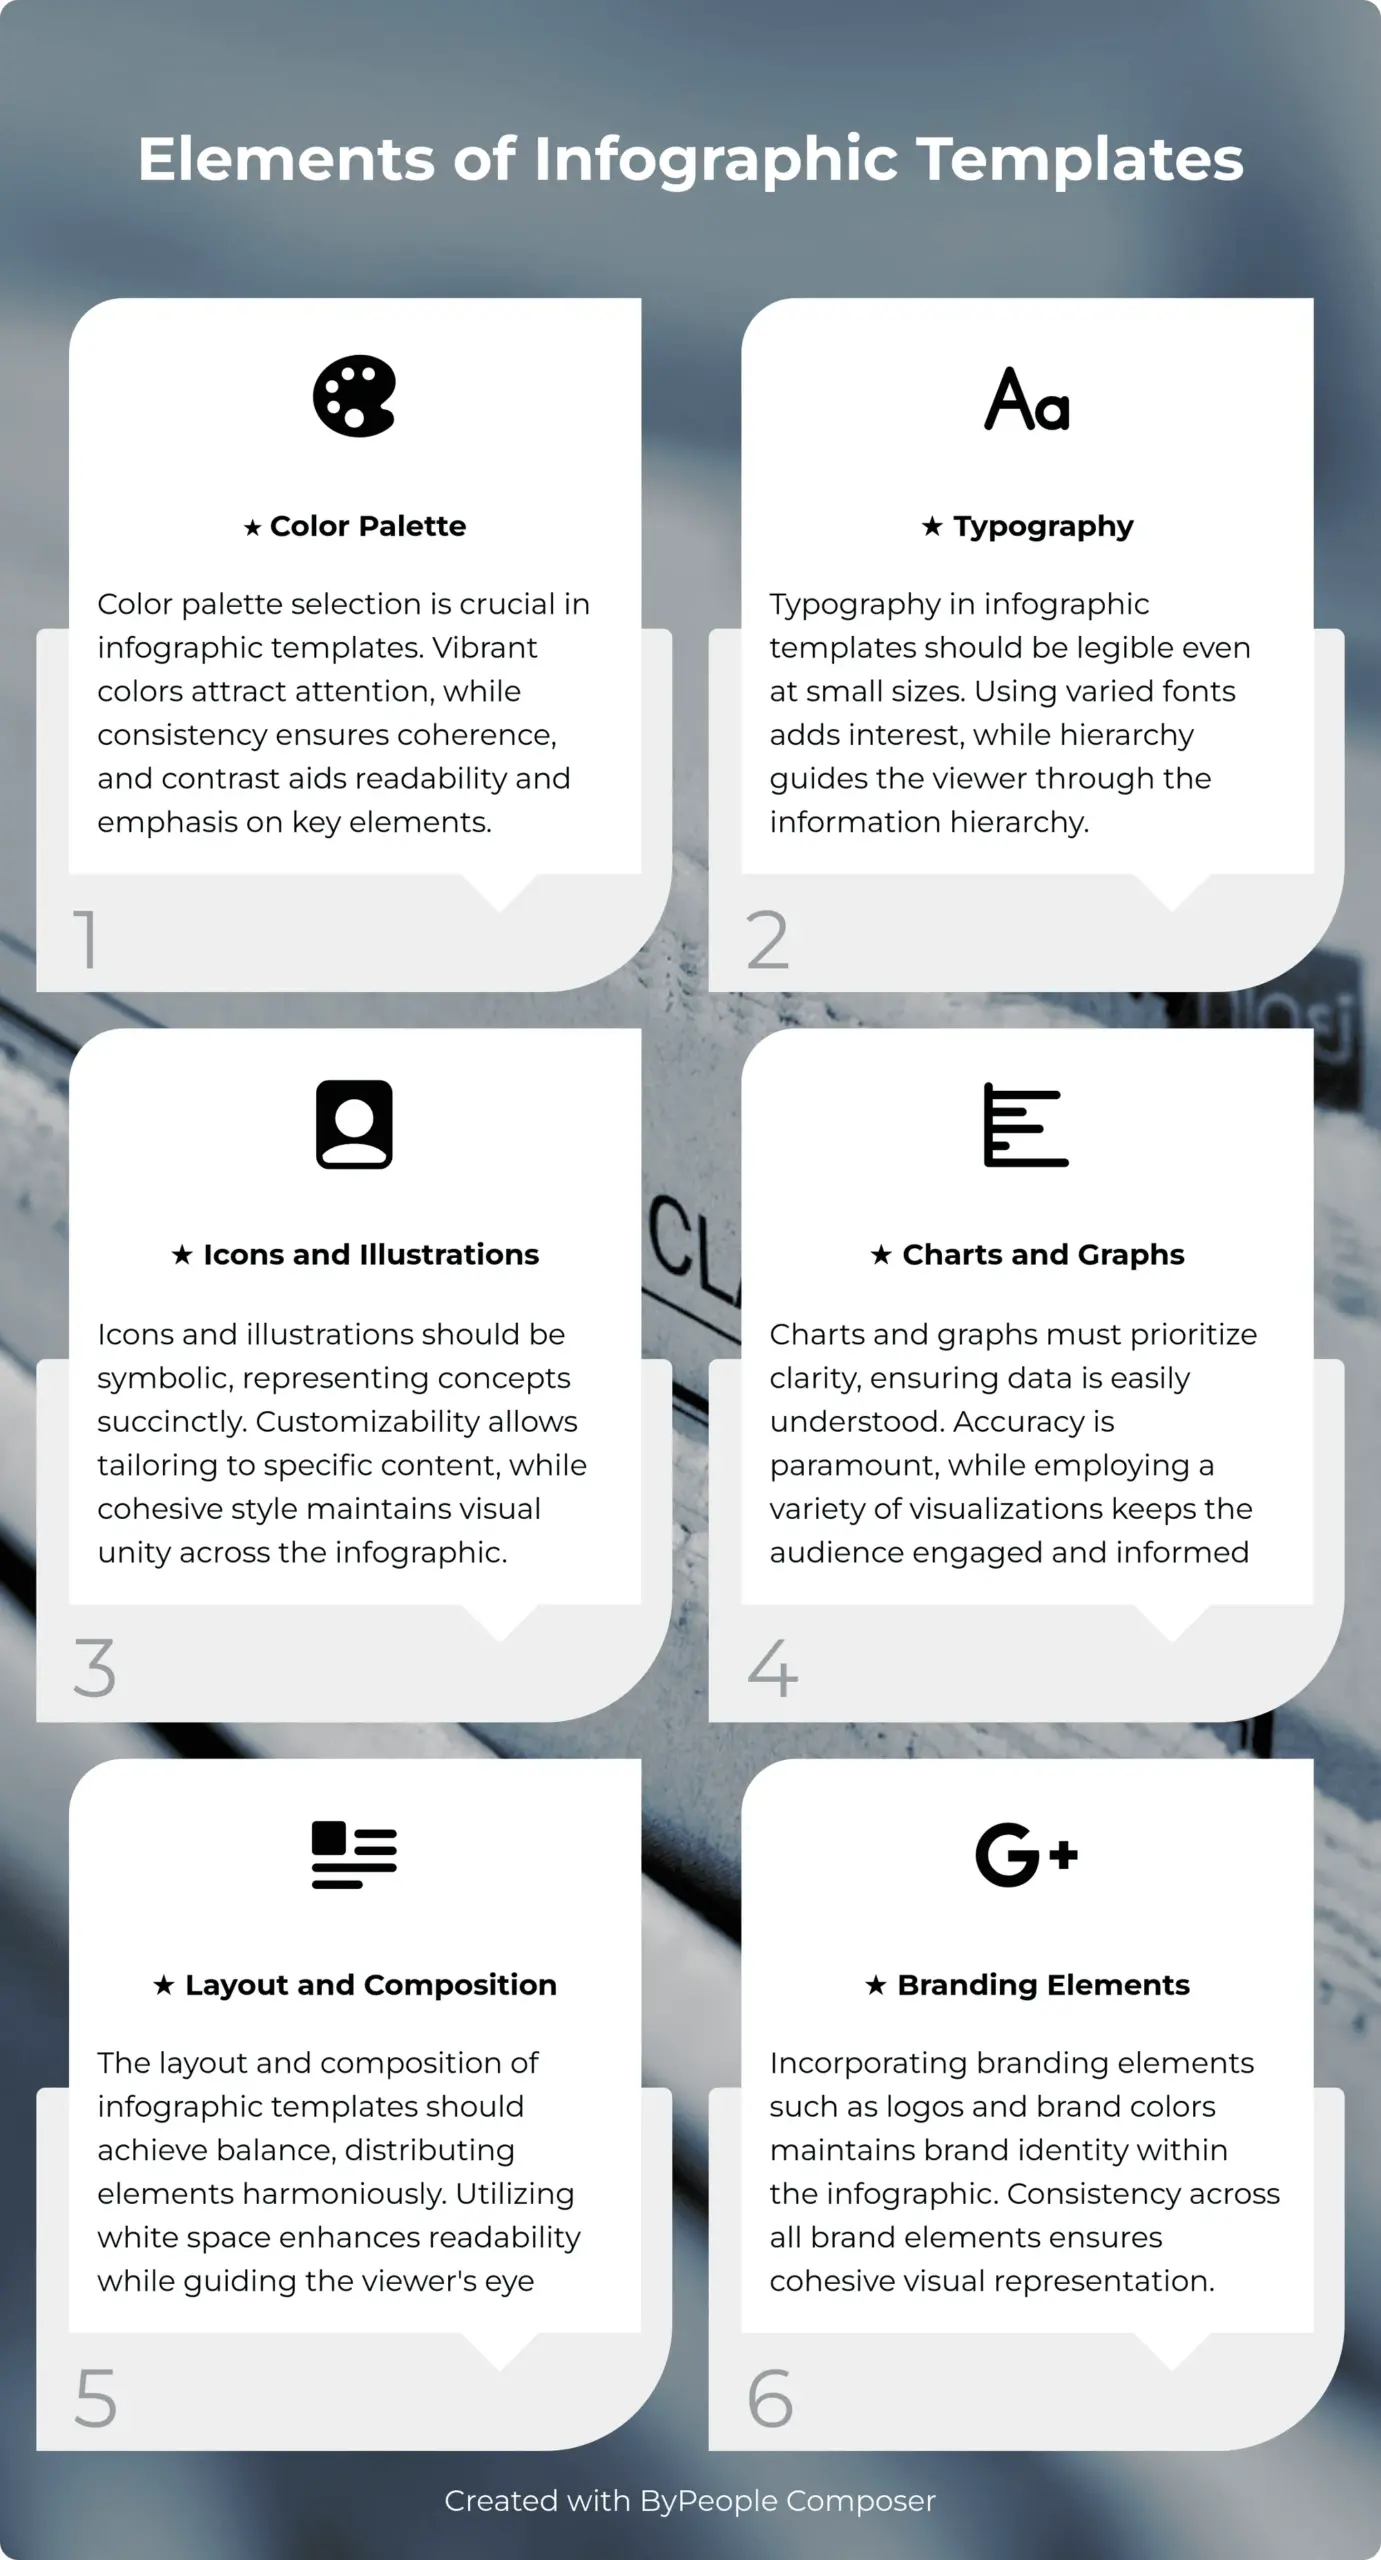
Along with the previously experience, mentioned elements and sections, certain design elements are crucial for creating an effective infographic. Here are some of them:
Typography: The font and its size are essential to make the infographic both readable and appealing. The typography should always be clear and easy to read, and it can be used to emphasize important ideas.
Color: Using the right colors can help you organize and highlight different sections and certain data. Different colors can be used to represent various categories or themes.
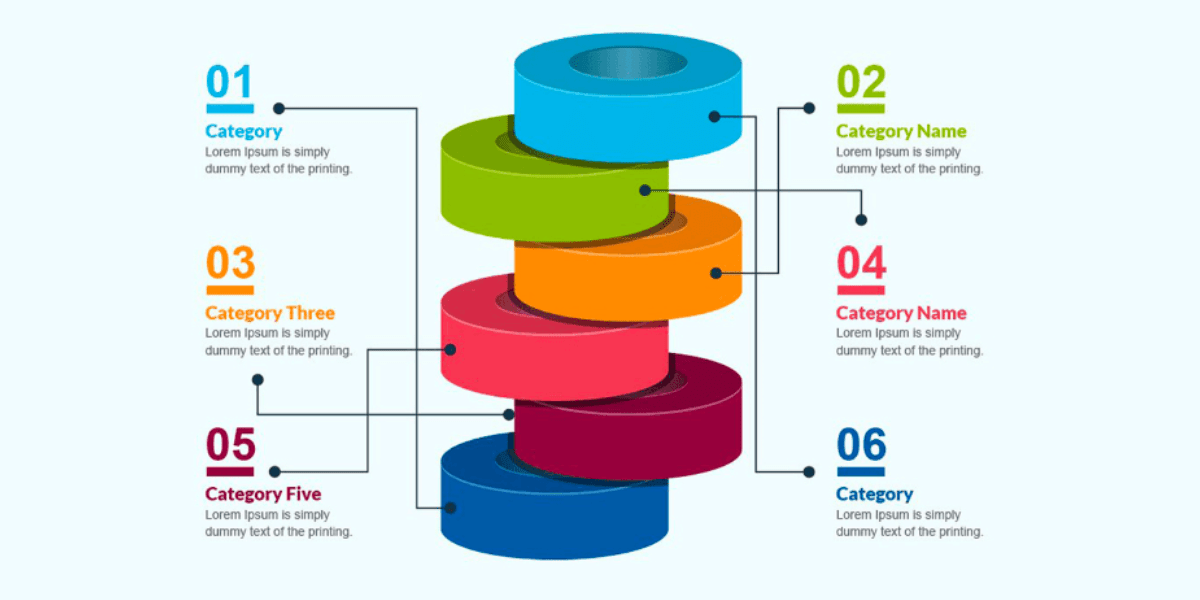
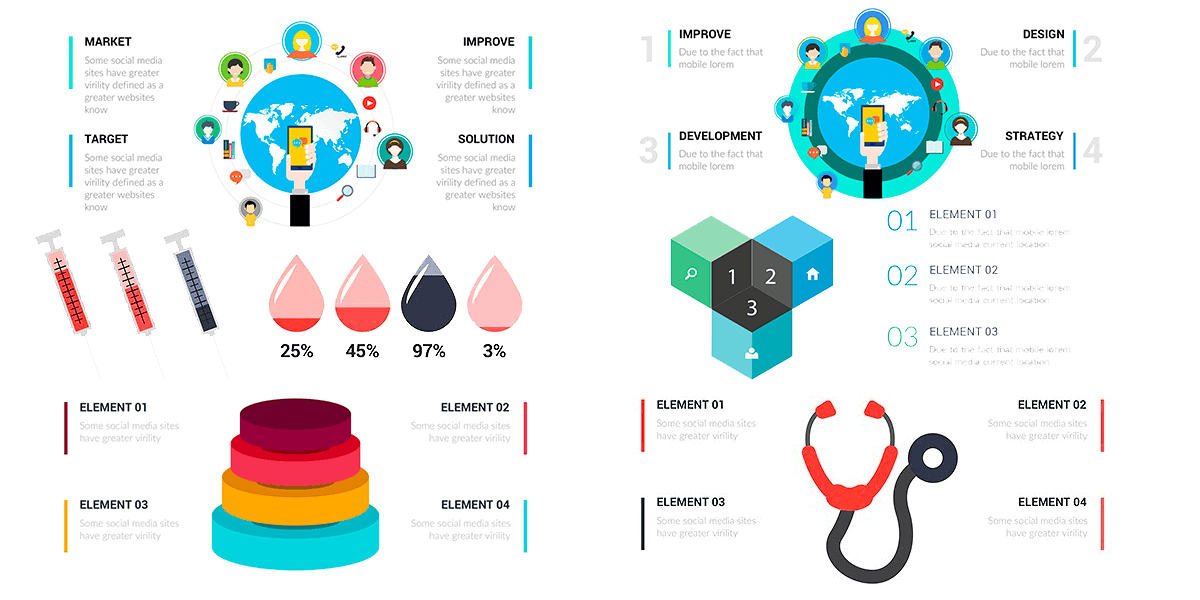
Icons and Vector Graphics: Icons and vector graphics are visual elements that can help convey information effectively and attractively. Icons can be used to represent different topics or categories, and vector graphics can be used to present data and statistics in a clear and attractive way.
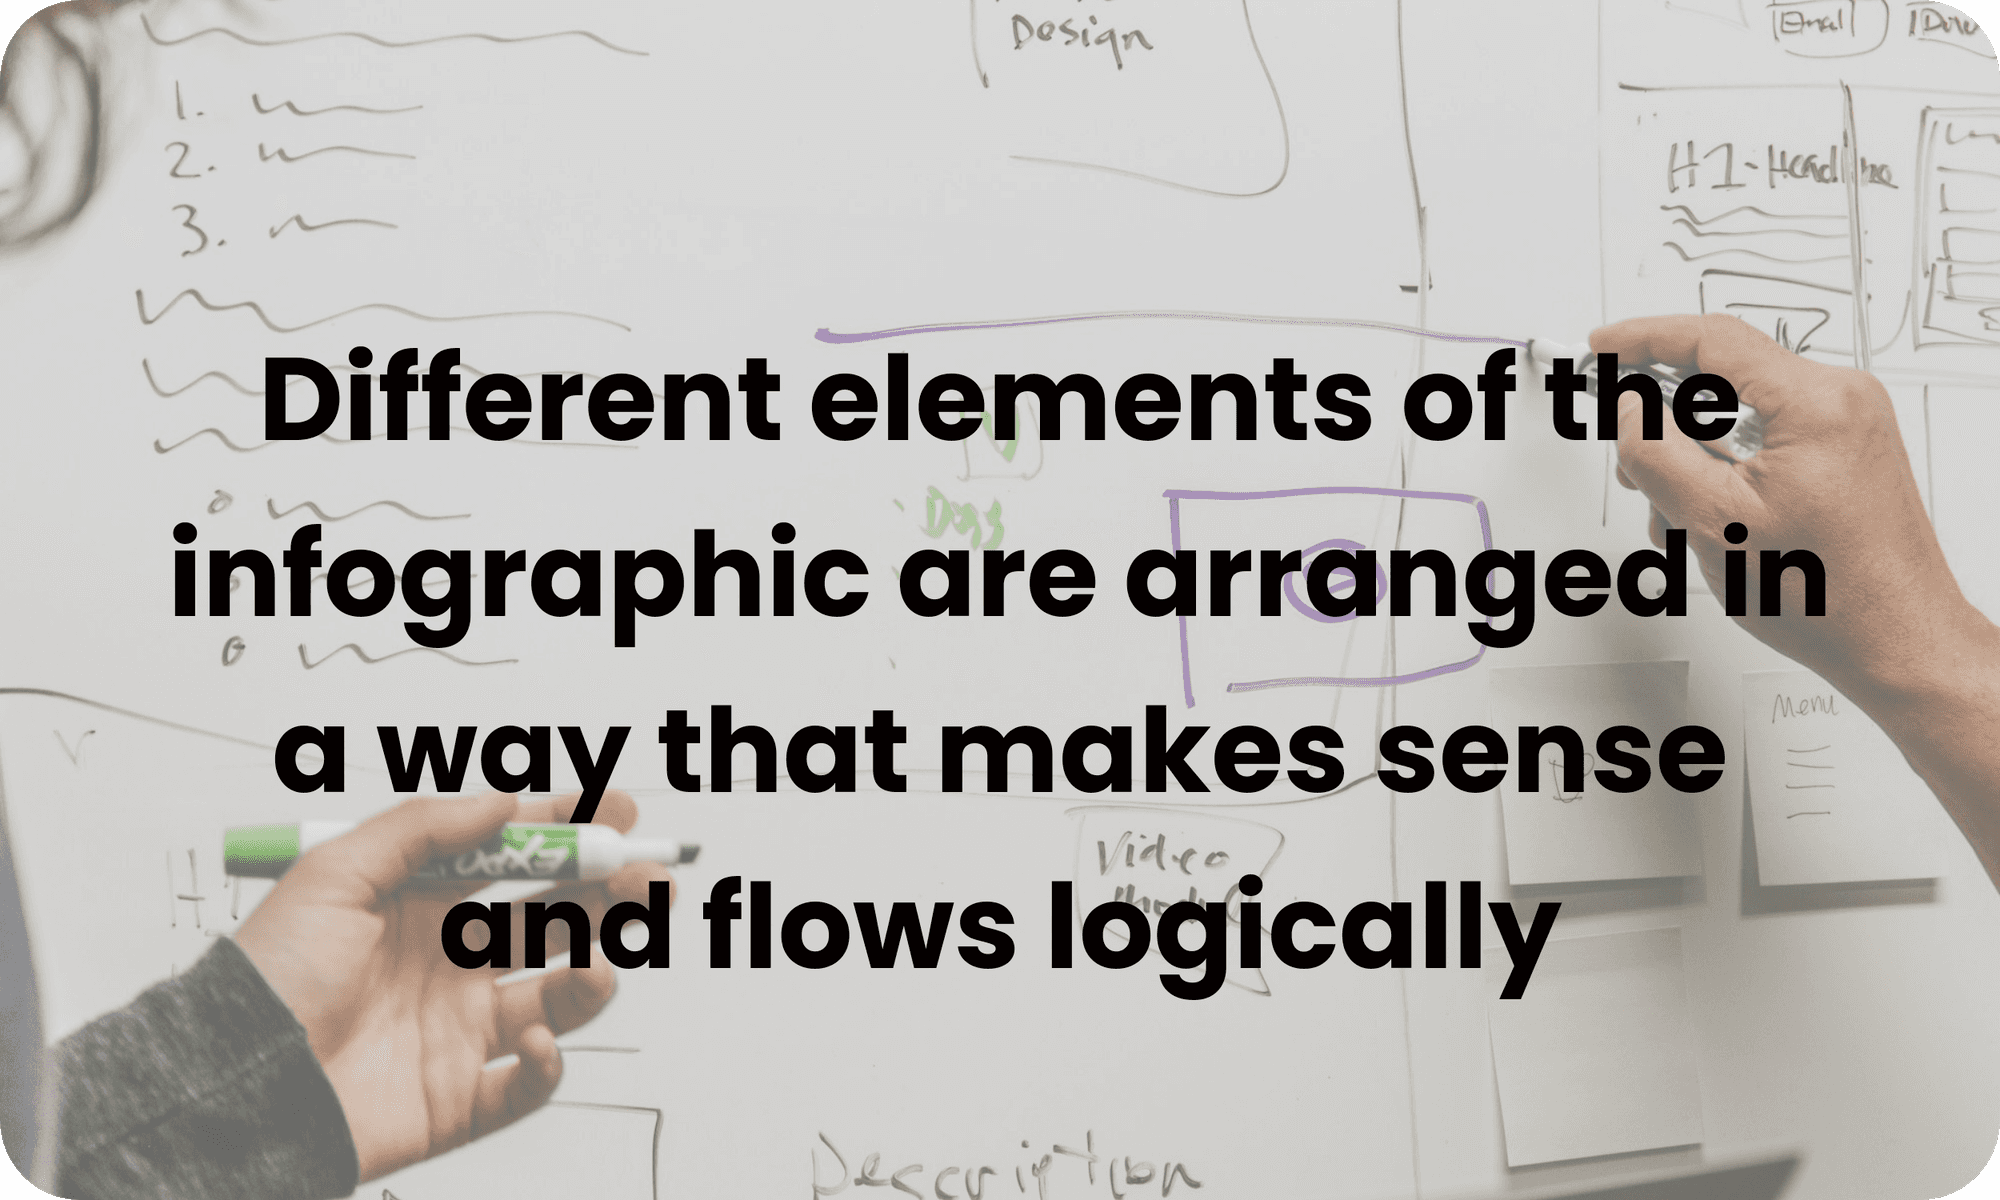
Layout and Composition: They allow the infographic to be clear and easily understandable. Design techniques like visual hierarchy and negative space can be used to create a balanced and visually appealing composition. It’s important to ensure that the different elements of the infographic are arranged in a way that makes sense and flows logically.
Here you can find more elements that infographic templates have.
Importance of Visual Consistency
Visual consistency is extremely important in creating effective infographics. It refers to using consistent and coherent visual elements throughout the infographic, such as typography, colors, graphics, and icons. By maintaining a visual consistency in the infographic, you can achieve an easy comprehension by using coherent visual elements and you can create attractive aesthetics when the colors and the elements complement each other to create a visually pleasing composition.
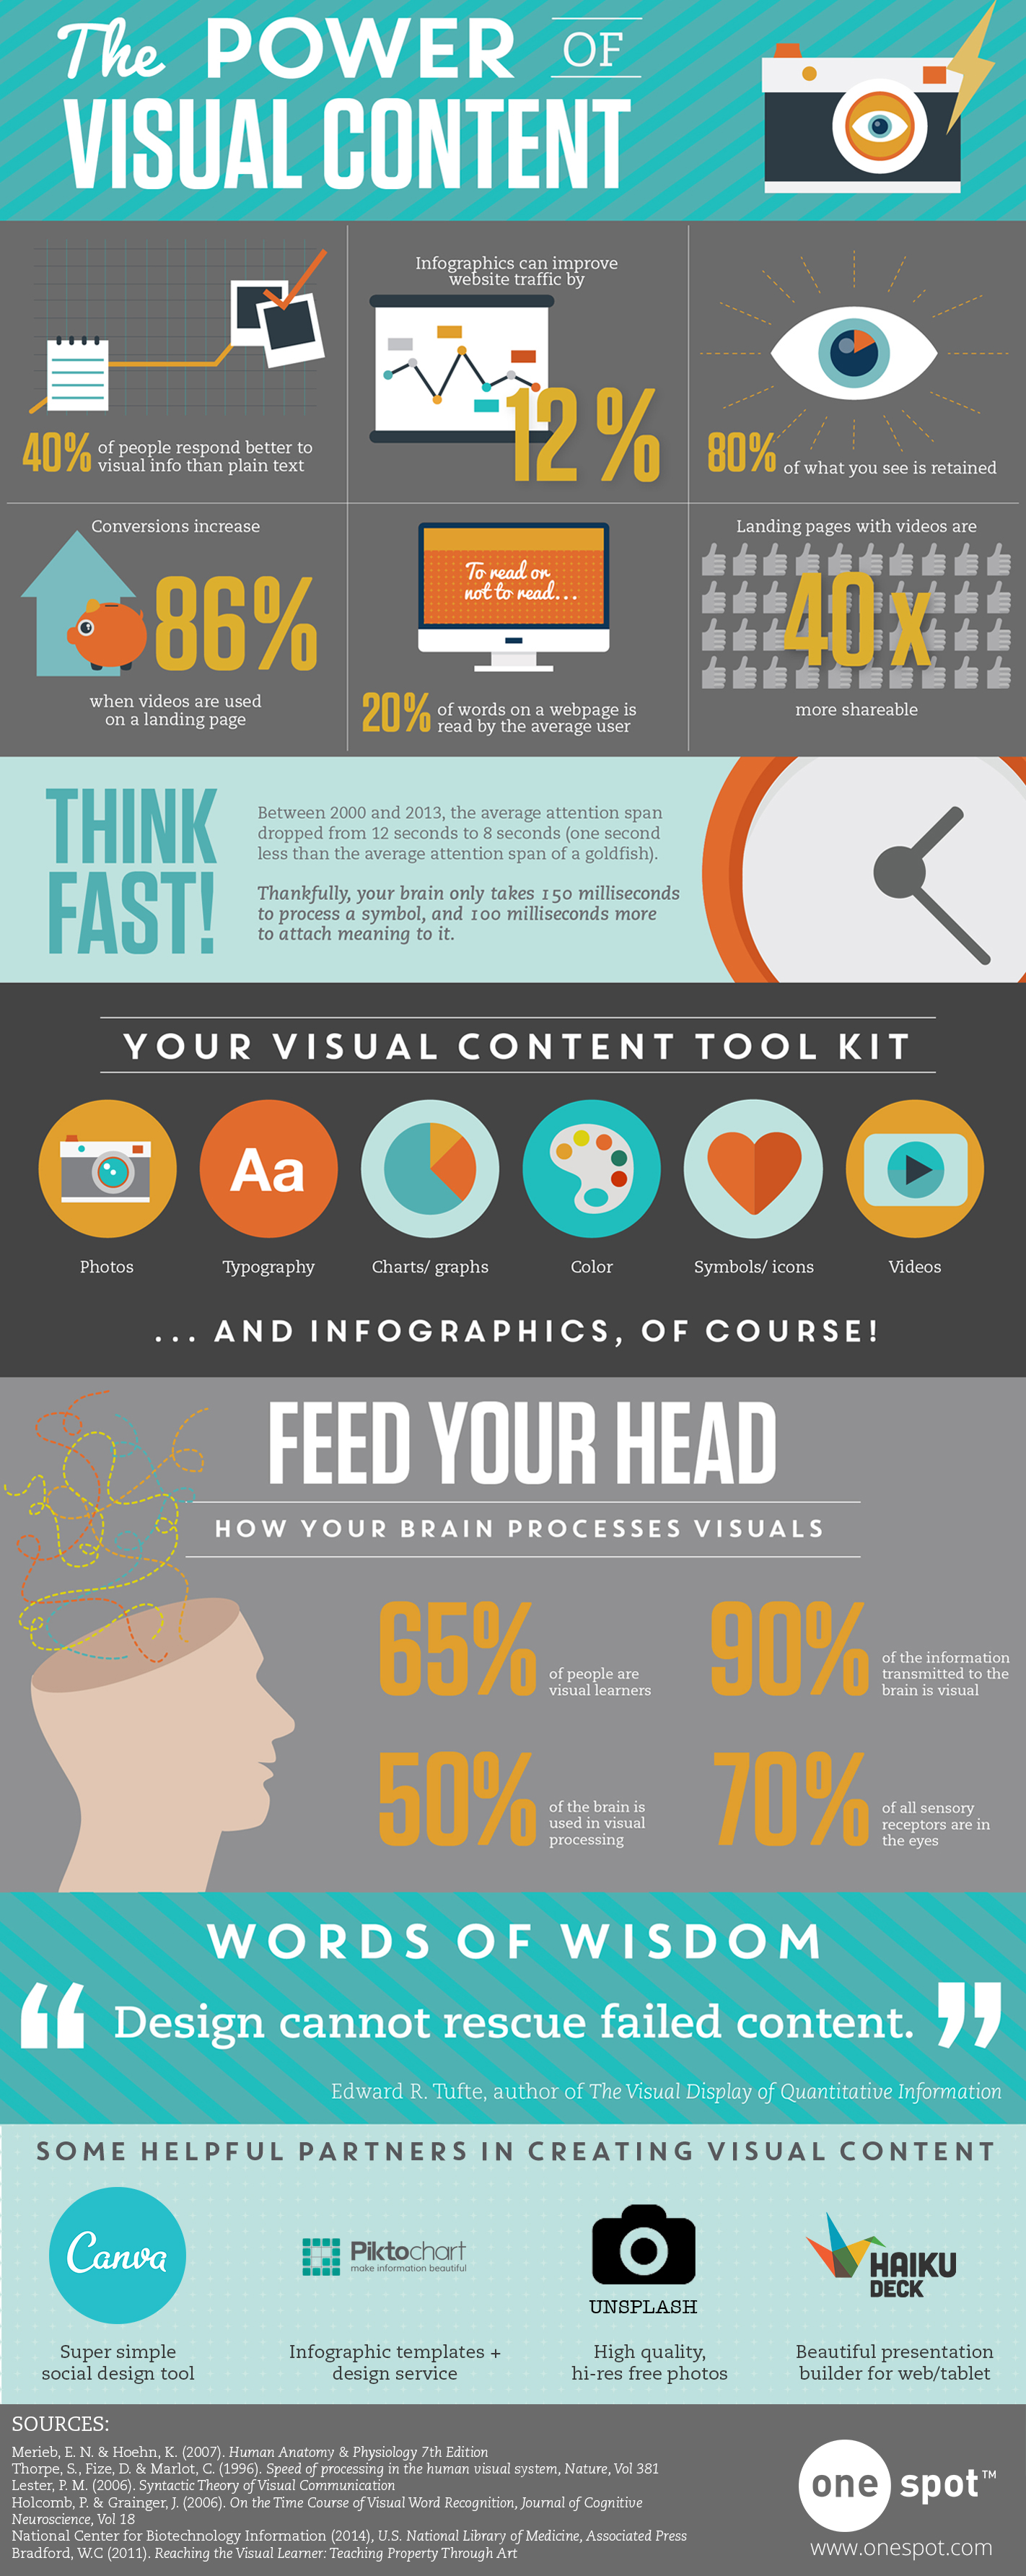
This visual consistency is fundamental, because infographics are considered the second most valuable visual content at 36.4% (Venngage, 2022) That’s why visuals always have a greater impact than the written word, and achieving visual consistency is accomplished by following patterns, coherence, and a common thread not only in the written content of the infographic but also in the graphic elements.
Importance of Infographic Templates in Marketing
But why are infographics relevant in bussinesses nowadays? Well, over 60% of businesses have used infographics in the past (Search Logistics). This means that it is a helpful tool to convey information that businesses want users to read.
Also Infographics are important for business because it can increase website traffic by up to 12%. (One Spot) On websites, it’s important to keep the audience constantly updated, so infographics are a way to present new information without having to continuously post large amounts of text.
Website traffic isn’t just driven by text; it’s also influenced by images. Therefore, it’s more effective to publish a good infographic instead of a long text that people probably won’t read. But with the right template, I assure you that an infographic will be more effective.
For example, this works when brands need to argue the effectiveness of their products, without give to the audience an amount of text.
I will tell you the case of a skincare brand. They must show its buyers figures and data that support the effectiveness of the elements contained in the products and how these have made an impact, not only with customers but also in general terms. Infographics help in these cases, as they can be visually read quickly and easily.
The information is then taken and organized according to the brand’s aesthetic. Presenting this type of graphics ensures that veracity and trust are taken into account because when it comes to skincare products, there should be justification so that people don’t think they are using things just for the sake of it. This results in sales for the company, as a good template with quality content can attract and retain customers.
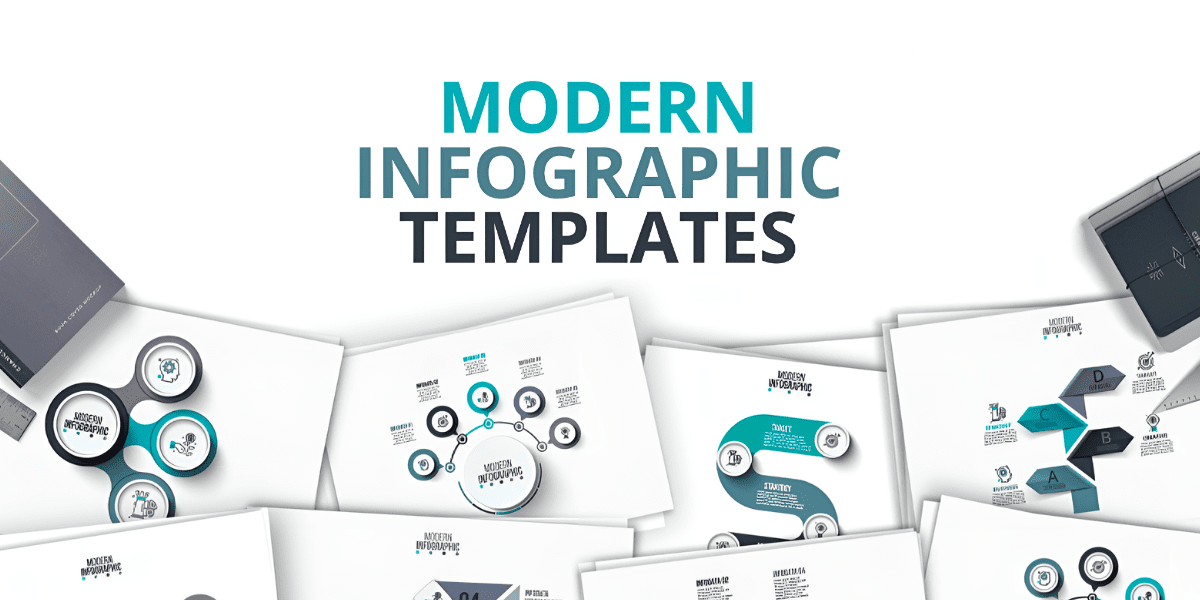
Infographic Templates that You Can Use
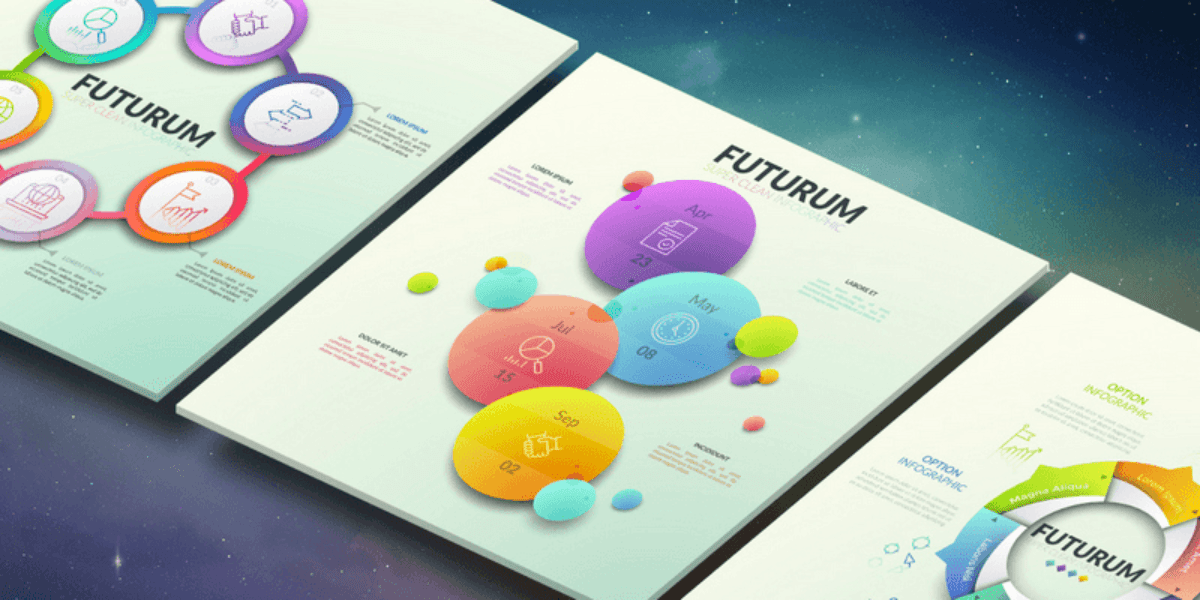
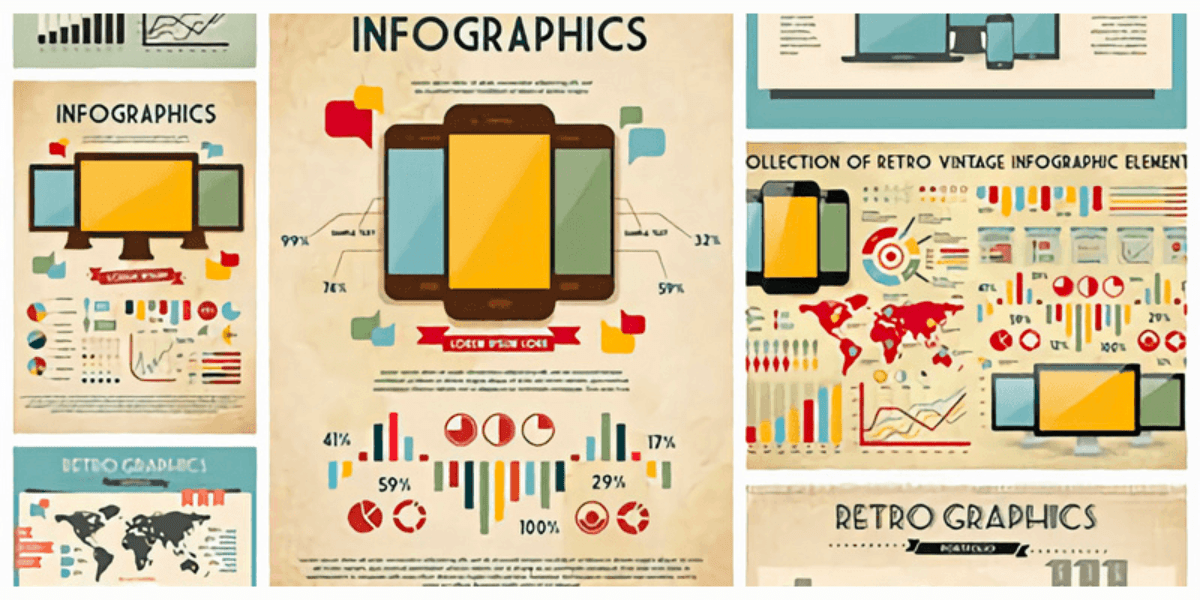
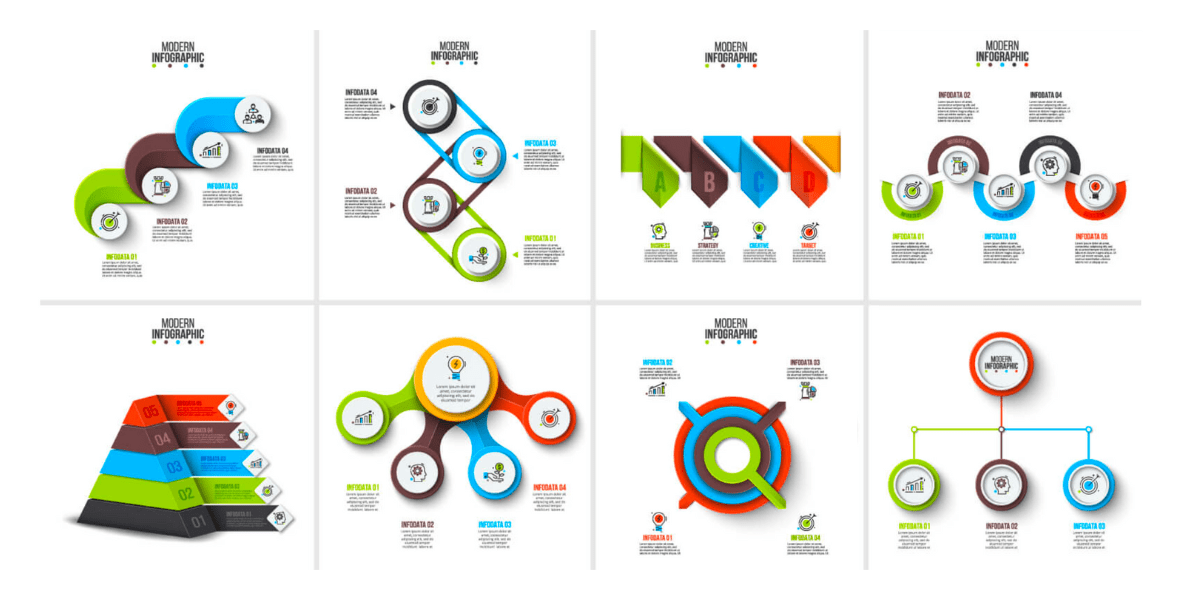
This awesome bundle of infographic templates is the perfect example of how to maintain visual consistency in your infographics. With over 2000 infographic templates, you can easily create eye catching and consistent designs. The templates have been carefully crafted with a uniform style, color palette, typography and layout, ensuring that your infographics look professional and cohesive.
Animated Infographic Templates Pack – Device Mockups, Graphs & Charts, Creative Infographics
This big collection of animated infographic presentation slides features more than 440 charts, graphs, infographic shapes and device mockup slides for PowerPoint. The files come in multiple supported formats such as PPT, PPTX, and .xlsx. It also includes mockups in which you can see the infographics on Apple devices, such as iPhones, iPads, iMacs and Macbooks, as well as Microsoft devices, Samsung cell phones, Google Pixel and many more. The designs also come in both Dark and Light versions.

This package has multiple benefits thanks to its features. Because the files come in PPT and PPTX formats, they allow you to add animations and effects to infographics quickly and easily. In addition, since it comes in different presentation formats, not only can they be used in each person’s preferred program, but this also allows all the templates and elements included in the package to be customized.

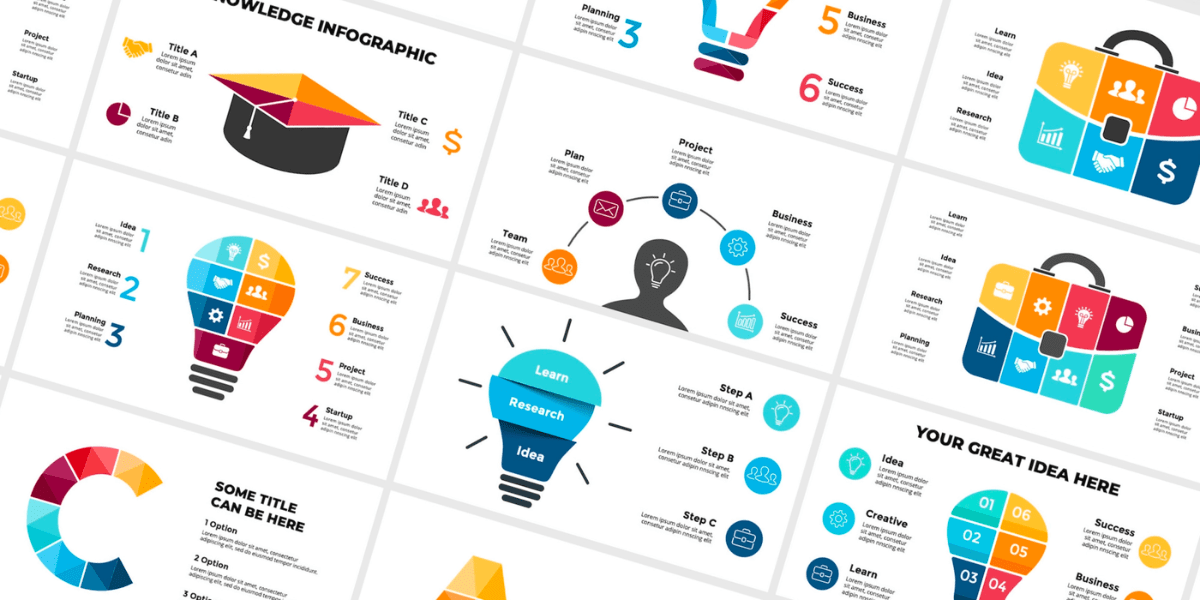
30,000+ Individual Infographic Elements, 1500 Templates in Ai, EPS, PSD & PPTX
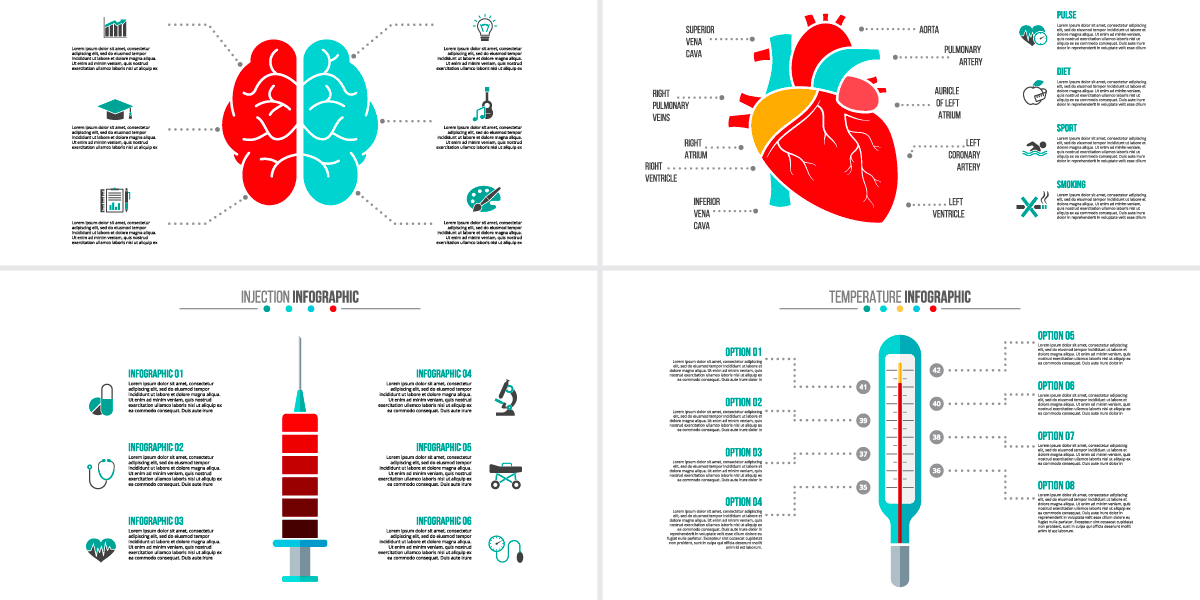
This mammoth bundle contains over 30k individual infographic elements and 1500 templates in AI, EPS, PSD and PPTX formats, also every style includes JPG and PNG files for quick reference and use. The pack includes over 22 infographic design styles including isometric illustrations, diagrams, geometric, medical, business, cycle, social media, circle, arrows and more! The templates and design elements in this bundle are professionally designed and of high quality.

With this bundle, you have access to templates that you can fully customize to match your project’s requirements. You can easily change the colors, fonts, and other design elements to ensure that your infographic is tailored exactly to your needs. These templates also provide a great starting point for users who may not have extensive design experience or want to save time in creating an infographic from scratch.The wide variety of file formats provide flexibility and compatibility across different platforms and software programs. This allows you to choose your ideal file format and your go-to software or platform.
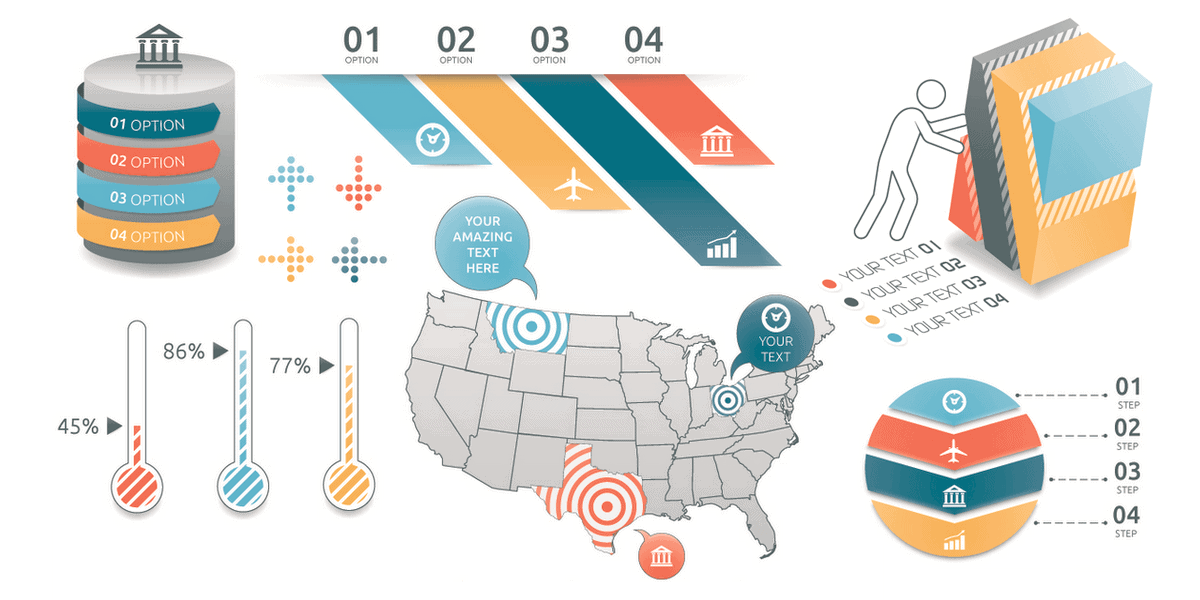
900+ Vector Infographic Elements, Ai & EPS File Formats, 150 Ready Templates
This bundle features 150 ready to use infographic templates with over 900 infographic elements, including shapes like arrows, graphs, social media charts, pyramids, timelines, maps, 3D geometric infographic shapes and much more. The elements are delivered in 2 vector source formats which are AI for Adobe Illustrator and EPS file formats that you can work with using softwares like Inkscape and GIMP.

The templates and infographic elements in this bundle are easy to use, even for those with little to no design experience or want to save time in creating an infographic from scratch.The templates come with pre-designed layouts, which users can modify to mix and match to create your own templates while maintaining a consistent design style across your projects, or simply edit the text, font and colors of a ready made templates to use for print/web straight away.
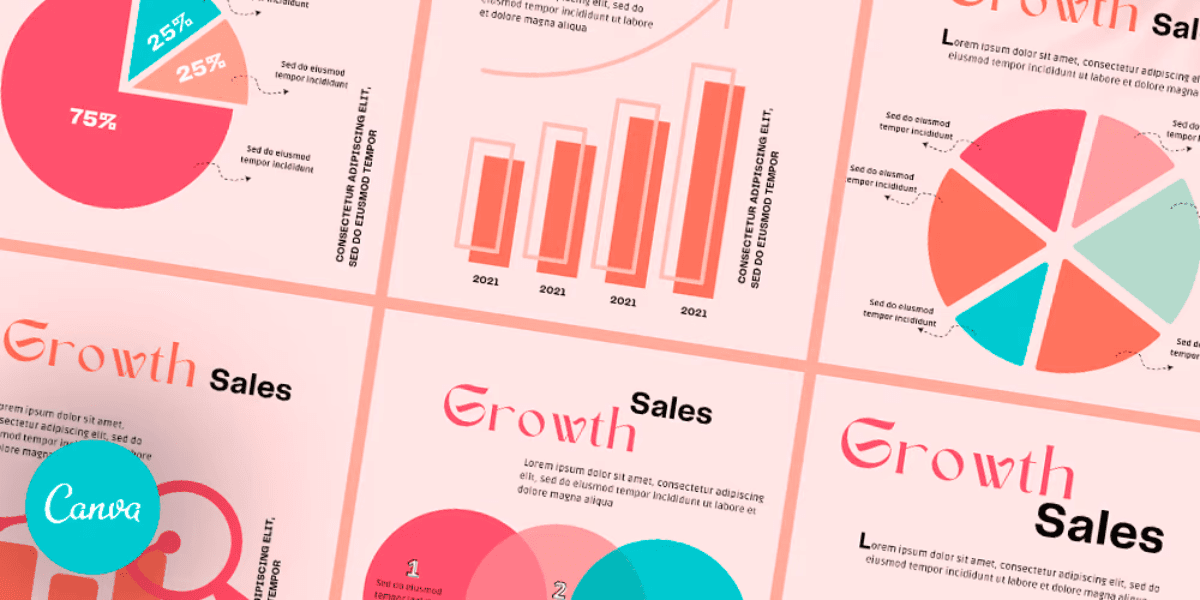
365+ Canva Instagram Templates, 18+ Content Categories
We all love Canva for many reasons, and it has become one of the most used graphic design tools. That is why we brought you this collection of social media templates that features more than 360 minimalistic designs for Instagram content with more than 18 post design categories that include infographics and charts. Every template comes in PDF file that you can work with on Canva.
All the templates in this bundle are professionally designed by experienced designers and the files are optimized for Instagram, which means they will look polished and engaging. Canva being the platform on which the templates are available, has a user-friendly interface that is easy to navigate. This bundle is an excellent option for social media managers, influencers and just about anyone who wants to create eye-catching Instagram posts with minimal effort.
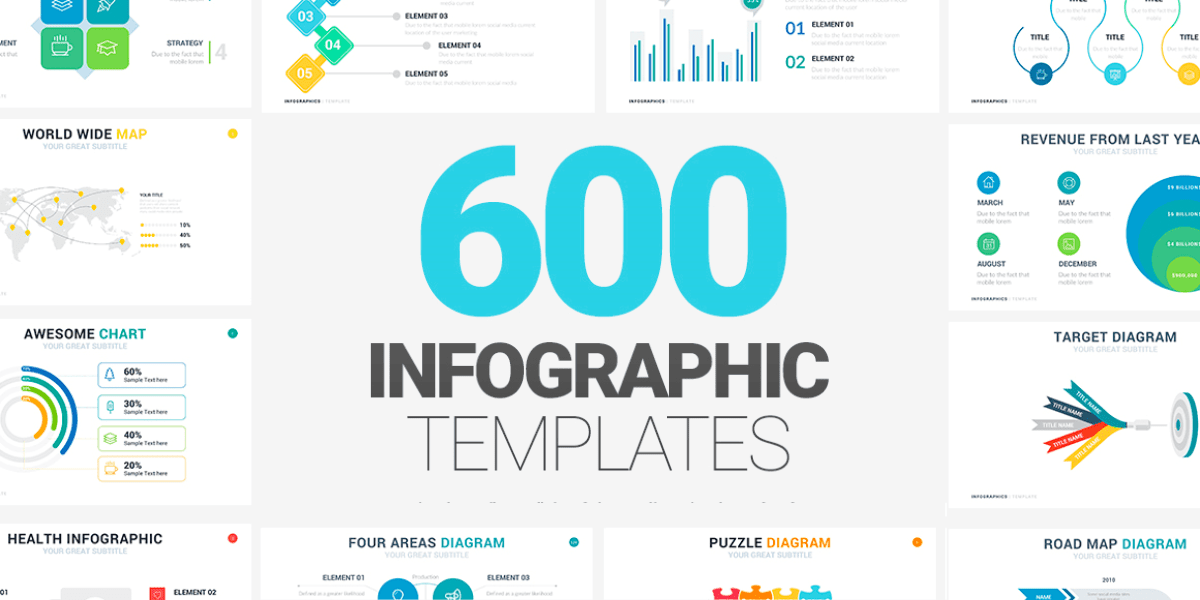
8k+ Individual Infographic Elements From 600+ Ready Made Templates
This huge bundle has 16 different infographic categories that include over 8000 individual vector elements and 2000 vector icons spread across more than 600 ready made infographic templates for Powerpoint, Keynote and Google Slides. The individual infographic elements can be used to customize the templates or create new designs from scratch, and they include icons, charts, graphs, maps, diagrams and more. The files come in AI, EPS, PSD and PNG formats.
The versatility of the infographic elements included in the pack makes it extremely useful for various types of projects, including presentations, reports, social media posts and websites. Since the templates and elements are fully customizable, the colors, fonts and every design element can be modified to match your brand and message. And the many file formats guarantee compatibility with a wide range of devices, platforms and softwares.
Animated PowerPoint Slides Pack, 3300+ Infographics, Vector Sources & Canva Files
This is the biggest animated powerpoint slides pack ever, this huge collection features the most diverse and comprehensive collection of infographics, photo slides and mockups for presentation templates. It contains more than 25 infographic and slide categories with over 3300 infographics templates delivered with files for PowerPoint, Keynote, Canva, Google Slides, Adobe Photoshop and Adobe Illustrator.
This bundle can be used for many purposes like business presentations, educational lectures, marketing campaigns and creative projects. It saves time since you customize the slides as you want, instead of starting from scratch, which saves hours of design time. Even beginners can easily use this tool to create professional and engaging presentations thanks to its user-friendly design. No advanced design skills or technical knowledge is required.
20,000+ Individual Vector Infographic Elements. 1000 Templates!
This very complete pack of more than 20000 fully editable individual vector infographic elements (including several professional fields and industry-specific illustrations) spread across 1000 highly customizable infographic templates. The files come in Ai, PSD and EPS vector formats, including JPG and PNG files with transparent backgrounds.
With this bundle you can customize the templates to your liking thanks to the diverse file formats included. And even using popular design softwares like Adobe Illustrator, you can fully edit and modify the templates as you want to. The best part? This pack includes a commercial license, which allows you to use the infographic templates and elements in any commercial project. So whether you’re creating presentations, marketing materials, or educational content, this bundle has got you covered.
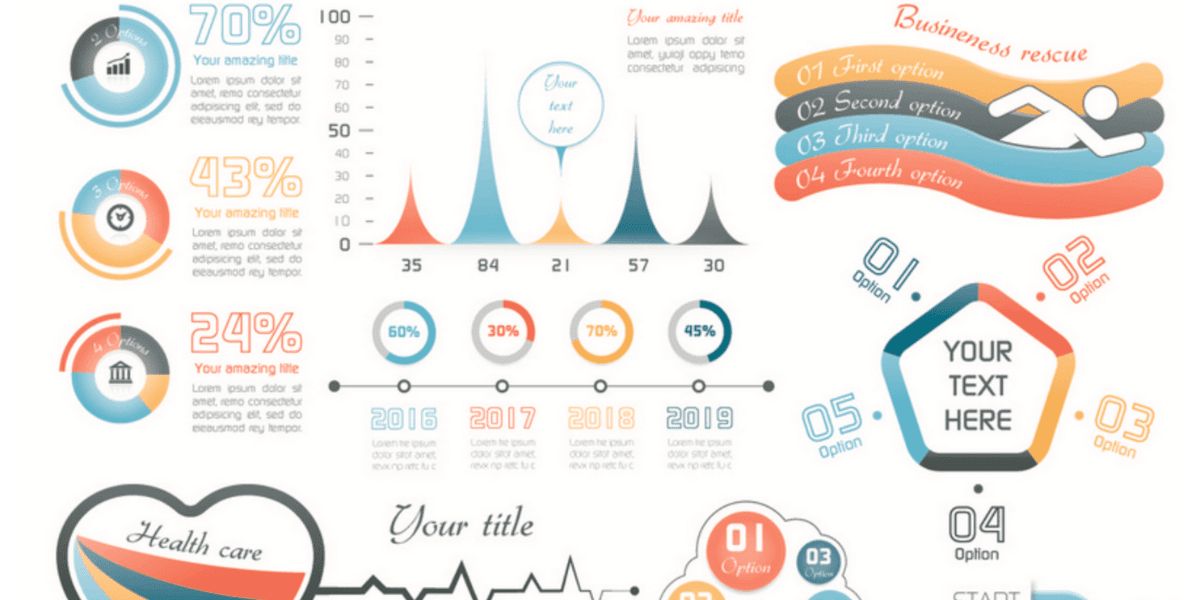
Vector Infographic Elements Bundle, Hundreds of Templates In Ai & EPS
This product is a comprehensive bundle of infographic elements that features hundreds of templates created in fully editable vector Ai and EPS file formats that you can work with on Adobe Illustrator. It features tons of different visual styles and unique color schemes, gradients, transparency and meshes for shadows and highlights.
Whether you’re working on a presentation, report, or marketing materials, you can easily and effectively convey information using these visually appealing graphics. Plus, with the vector formats included, you can scale the graphics to any size without worrying about losing quality. So, you can save time and effort while creating professional-looking designs that stand out.
After showing you all these template examples, we can conclude that they help to better structure infographics and enhance the value of the information. Remember all the guidelines we gave you at the beginning to understand how to combine information with design, as infographics focus on the critical and detailed aspects of information. Using the right colors, typography, icons, among others, is key to achieving the media impacts that this type of visual and communication tool can have.

Juan Pablo Sarmiento
System engineer from the National University of Colombia, with special interest over entrepreneurship, marketing, productivity and well-being.
Several projects and startups launched in over 20 years of experience.
Best Seller Deals
Check out time-limited deals on software and designs packs